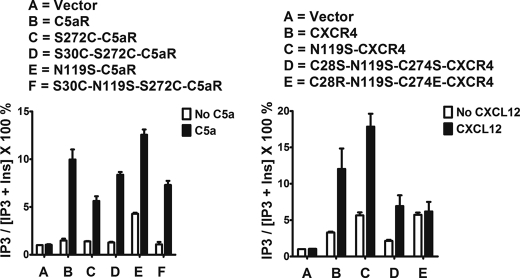
FIGURE 10.
Signaling assays in COS-7 cells expressing Gα16 with wild type or mutant receptors. Left and right panels, respectively, represent C5aR and CXCR4. The cells were stimulated with 10 nm C5a (C5aR) or 100 nm CXCL12 (CXCR4). IP3 accumulation values are normalized to the mock transfections, where each bar represents means ± S.D. of three independent experiments.

