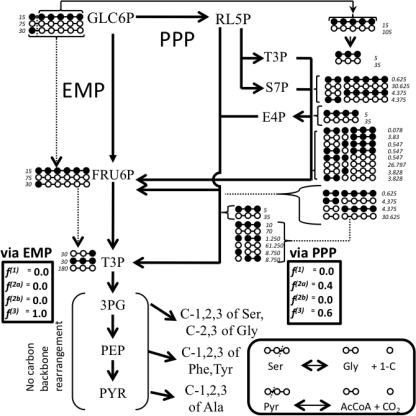
FIGURE 4.
Carbon backbone rearrangement during the metabolism of glucose through the EMP and pentose phosphate (PP) pathways and its effect on the labeling pattern and fractions of intact versus broken fragments of pyruvate, phosphoenolpyruvate, and 3-phosphoglycerate. For simplicity, only irreversible routes are depicted. A 12.5, 25, and 62.5% mixture of uniformly labeled, C1-labeled, and unlabeled glucose, respectively, was used for this illustration. Labeled and unlabeled carbon atoms are illustrated by filled and open circles, respectively. Carbon atoms connected by − represent intact fragments arising from source glucose molecule and absence of – between two carbon atoms represents a broken bond. The numbers next to a molecule represent the total number of that species formed when 15 molecules of uniformly labeled, 30 molecules of C1-labeled, and 75 molecules of unlabeled glucose were processed through the EMP or pentose phosphate pathways. As in the example shown, there is no direct carbon backbone rearrangement between glyceraldehyde 3-phosphate (T3P), 3-phosphoglycerate (3PG), phosphoenolpyruvate (PEP), and pyruvate (PYR); the numbers will be the same for these four metabolites. The fi values shown in rectangular boxes depict the fraction of intact and broken carbon fragments relative to the central carbon atoms of the aforementioned metabolites (see text for definition of fi). Two sets of fi values are shown, one for the case when these metabolites are generated via the EMP pathway (left box) and the other one when they are generated through the PPP (right box). Also shown in a rounded box is the interconversion of serine, glycine, and one-carbon (1-C) units, which is the major source of glycine and 1-C units for cellular metabolism (41). The reversible conversion of pyruvate to acetyl-CoA via PFL is included in the same box.

