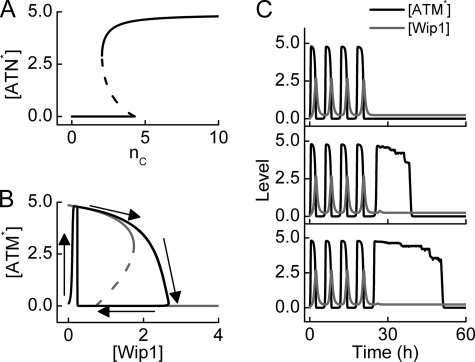
FIGURE 5.
ATM dynamics with two phases. A, shown is a bifurcation diagram of ATM* level versus the number of DSBCs, nC. ATM is activated if nC > 4 and inactivated if nC < 2. B, bifurcation (gray) and phase (black) diagrams of ATM* level versus Wip1 level. The ATM* level either shows pulses or behaves as a switch, depending on Wip1 levels. C, shown are time courses of ATM* (black) and Wip1 (gray) levels for three individual cells at DIR = 5 Gy. Due to stochasticity in the generation and repair of DNA damage, there exists remarkable variability in cellular responses.

