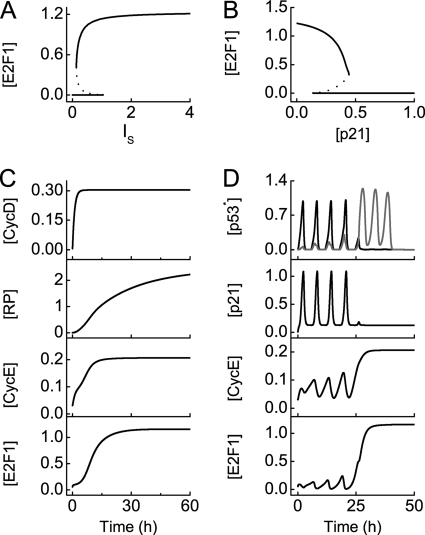
FIGURE 7.
Cell cycle arrest and reentry into S phase. Shown is a bifurcation diagram of [E2F1] versus the concentration of serum, IS, (A) or [p21] (B). C, shown are time courses of [CycD], [RP], [CycE], and [E2F1] at the G1/S transition in unstressed cells with IS = 10. D, shown are time courses of [p53 arrester] (black) and [p53 killer] (gray), [p21], [CycE], and [E2F1] in stressed cells with IS = 10 and DIR = 5 Gy.

