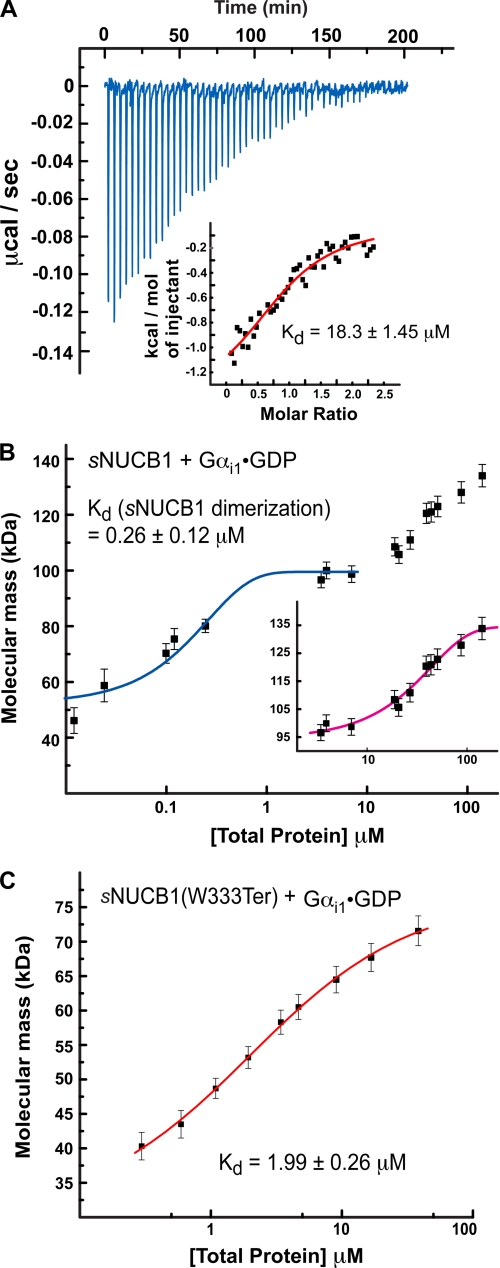
FIGURE 4.
Interaction of sNUCB1 and Gαi1·GDP. A, we used ITC to measure the binding of Ca2+-free sNUCB1 to Gαi1·GDP. The heat released per injection of aliquots of a solution of Gαi1·GDP (200 μm) into a buffered solution of Ca2+-free sNUCB1 (50 μm) was recorded, and the area under the curve was integrated. The heat of dilution for the addition of Gαi1·GDP to buffer alone was subtracted. A nonlinear least squares fit of the calculated values using the one-set of sites model for dimeric sNUCB1 resulted in a satisfactory fit with a dissociation constant of 18.3 ± 1.45 μm as shown in the inset. We used MALS to measure the formation of a complex between sNUCB1 and Gαi1·GDP (B) or the truncation mutant sNUCB1(W333Ter) and Gαi1·GDP (C). MALS data were collected on protein complex peaks eluting from Superdex200 10/30 HR size-exclusion chromatography connected to a high performance liquid chromatography system equipped with an autosampler. Samples with increasing protein concentrations were successively injected onto the column, and the eluate was monitored using a photo-diode UV-visible detector, a differential refractometer, and a static multiangle laser light scattering detector. The weight average molecular weight of the complex was determined as a function of increasing protein concentrations. The magenta curve in B, inset, and the red curve in C indicate nonlinear least square fits for a complex formation model of weight average molecular weight values determined for the apex of each eluting peak at various concentrations. The error bars indicate extent of variation in molecular mass determination originating from the light-scattering measurement. The data for sNUCB1-Gαi1·GDP complex formation shows that association between the protein subunits occurs only after dimerization of sNUCB1 (blue curve). The data suggest that one Gαi1 subunit binds to a dimer of sNUCB1 and a monomer of sNUCB1(W333Ter), respectively, and that the binding site for Gαi1 lies in the sNUCB1(W333Ter) sequence.

