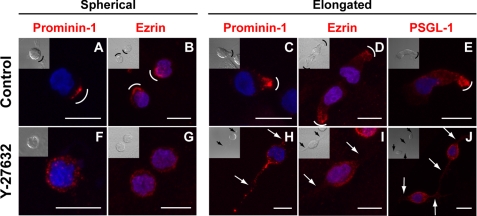
FIGURE 2.
Redistribution of membrane and cytoplasmic proteins upon treatment of hematopoietic progenitors with the ROCK inhibitor Y-27632. HSPCs cultured on MSCs for 3 days in the absence (A–E) or presence (F–J) of Y-27632 were analyzed by indirect immunofluorescence either by cell surface labeling (A, C, F, and H) or upon permeabilization (B, D, E, G, I, and J). HSPCs exhibiting either a spherical (A, B, F, and G) or elongated (C–E and H–J) morphology are depicted. A–E, the distribution of prominin-1, ezrin and PSGL-1 (all in red) is polarized in untreated HSPCs (A and C, prominin-1; B and D, ezrin; and E, PSGL-1). F–J, in the presence of Y-27632, prominin-1 (F and H), ezrin (G and I), and PSGL-1 (J) are redistributed over the entire plasma membrane or cytoplasm. A differential interference contrast image is shown in the inset. Nuclei were visualized with DAPI (blue). Curved lines indicate the clustering of either prominin-1, ezrin, or PSGL-1; arrows point to the long and thin plasma membrane protrusions observed in Y-27632-treated cells. Scale bars, 10 μm.

