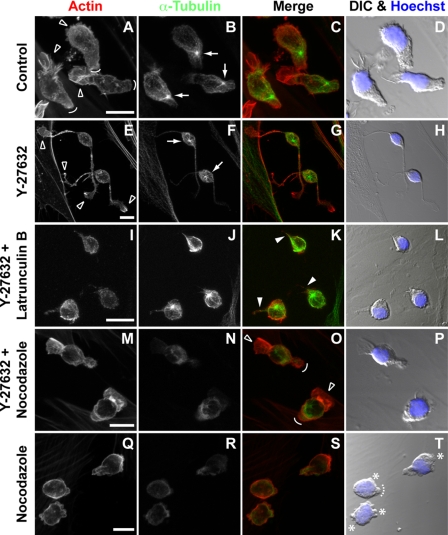
FIGURE 5.
The microtubule network is involved in the tail retraction of migrating hematopoietic progenitors. A–T, HSPCs cultured on MSCs were subjected to different treatments as indicated, prior to actin (red) and α-tubulin (green) fluorescence labeling and confocal microscopy analysis. Composites of 7–10 x-z optical sections are shown. Nuclei were visualized by Hoechst labeling (blue). Differential interference contrast (DIC) images are shown (D, H, L, P, and T). A–D, untreated HSPCs (Control); outlined arrowheads point the lamellipodium (migrating front), whereas curved lines indicate the uropod (rear pole of migrating cells). Arrows show the position of the centrosome. E–H, Y-27632-treated HSPCs; outlined arrowheads indicate lamellipodia at the edge of the long and thin plasma membrane protrusions induced by Y-27632 treatment, and arrows show the position of the centrosome. I–L, depolymerization of actin filaments with latrunculin B in Y-27632-treated HSPCs; filled arrowheads indicate reminiscent tails. M–P, depolymerization of microtubules with nocodazole in Y-27632-treated HSPCs; outlined arrowheads and curved lines indicate the restored lamellipodium and the uropod-like structure, respectively. Q–T, depolymerization of microtubules with nocodazole in HSPCs; asterisks indicate bleb-like membrane protrusions, whereas the dashed curved line shows a remnant of a uropod. Scale bars, 10 μm.

