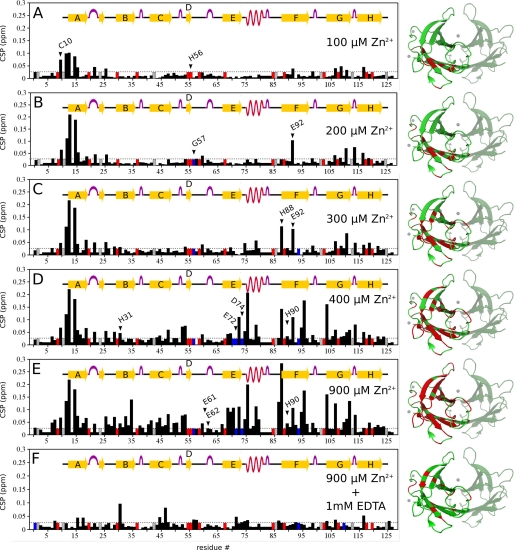
FIGURE 4.
Mapping Zn2+ binding to TTR by TROSY-HSQC measurements at pH 7.5. The chemical-shift perturbations (CSP) in the NMR spectrum of fully 15N-2H labeled WT-TTR (100 μm) were measured at different concentrations of ZnCl2. CSP derived from differences between a reference spectrum of WT-TTR in the absence of Zn2+ and the spectra in the presence of Zn2+ were obtained for: (A) 100 μm ZnCl2; (B) 200 μm ZnCl2; (C) 300 μm ZnCl2; (D) 400 μm ZnCl2; (E) 900 μm ZnCl2, and (F) 900 μm ZnCl2 + 1 mm EDTA. Blue bars are residues whose signal vanished during the experiment; red bars are non-assigned residues; gray bars are prolines. Images at the right show where CSP occurred in WT-TTR at each Zn2+ concentration, marked in red in a ribbon representation of Zn2+:TTR pH 7.5 (PDB ID 3GRG). For clarity, only one of the four monomers is marked. Zn2+ atoms are represented as gray spheres. CSP was calculated for each assigned main-chain amide using Equation 1. Dotted lines show the threshold for considering a CSP significant (0.025 ppm).

