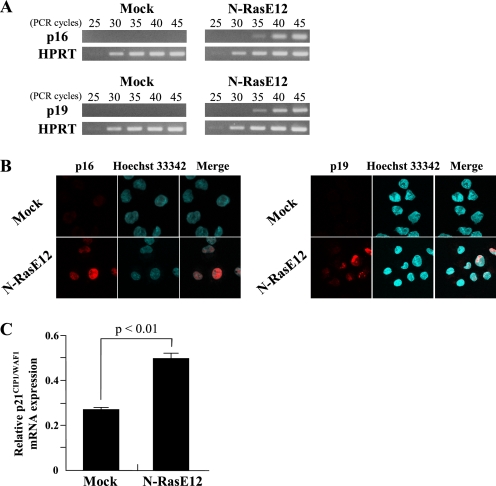
FIGURE 5.
Increase in expression levels of p16INK4a, p19ARF, and p21CIP1/WAF1 by oncogenic Ras. A–C, LSK cells transfected with Mock or N-RasE12 were cultured with rmSCF, rmIL-3, and rhEPO for 2 days. Total RNA was isolated from GFP+ cells, and the expression levels of p16INK4a and p19ARF were analyzed by semiquantitative RT-PCR (A). Immunofluorescence staining of p16INK4a and p19ARF localizations (red) in Hoechst 33342-stained nuclei of GFP+ cells are shown (magnification, 630×) (B). The expression levels of p21CIP1/WAF1 were analyzed by real-time RT-PCR. The results are normalized to the levels of HPRT gene and shown as means ± S.D. (n = 3) (C).

