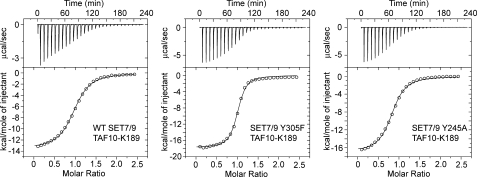
FIGURE 1.
ITC analysis of WT SET7/9 and the Y245A and Y305F mutants. Representative titrations and binding isotherms for the calorimetry experiments are shown for the unmodified TAF10-K189 peptide titrated into WT SET7/9 (left plot), SET7/9 Y305F (middle plot), and SET7/9 Y245A (right plot). In each panel, the ITC titration experiment (upper panel) is shown with the binding isotherms (lower panel) fit to a single binding site model.

