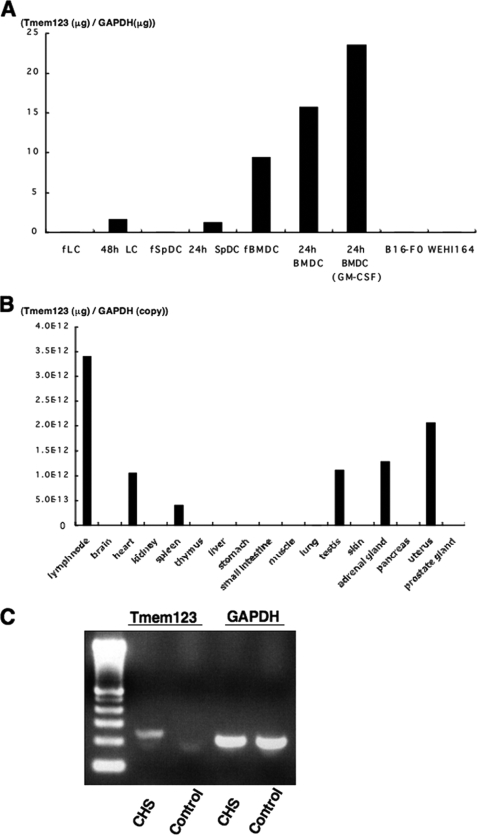
FIGURE 2.
Cell and tissue distribution of Tmem123 mRNA. A, comparative analysis of Tmem123 mRNA expression levels between fresh DCs (LCs, SpDCs, and BMDCs), mature DCs, and two other cell lines (B16-F0 and WEHI164 cells). Fresh DCs (fLC, fSpDC, and fBMDC) were cultured for 24 or 48 h with or without GM-CSF (10 ng/ml) to induce maturation. B, Tmem123 expression in various tissues. C, Tmem123 mRNA expression in the CHS-elicited ear skin and control ear skin. The result from a representative experiment is shown. A, n = 2; B, n = 3; C, n = 3.

