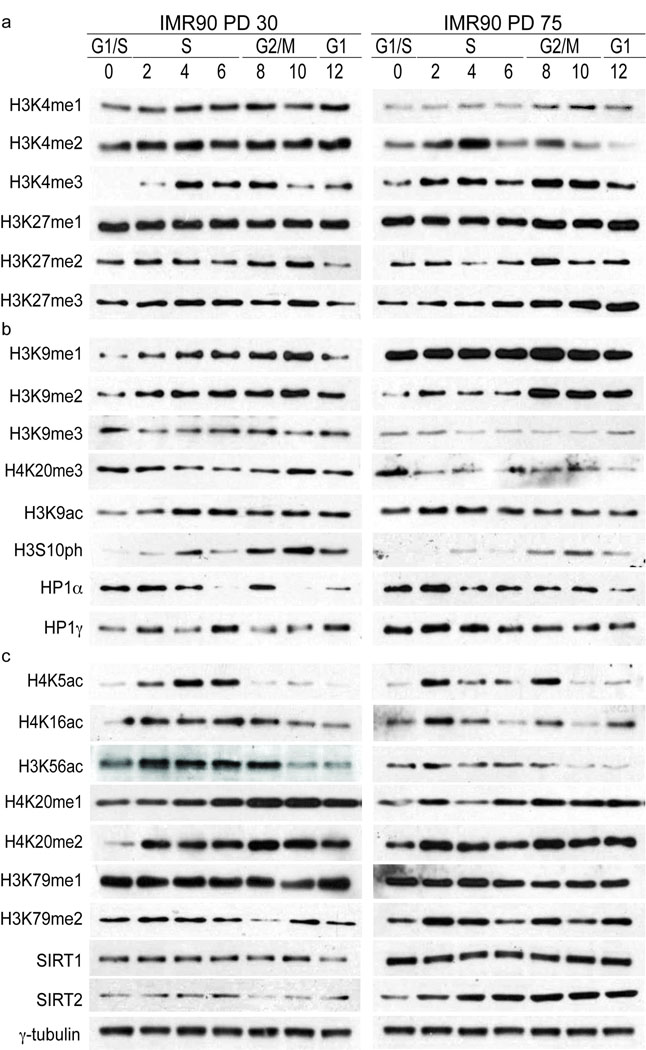
Figure 2.
Cell cycle distribution of histone modifications in early and late passage cells. (a) Cell cycle distribution of histone modifications in whole cell extracts from PD30 and PD75 HDFs. Shown are cell cycle patterns of modifications involved in transcriptional regulation (H3K4me1/2/3 and H3K27me1/2/3). 75,000 cell equivalents were loaded per lane and histones were visualized by ponceau staining prior to probing with primary antibodies. Hours after G1/S release are indicated and corresponding cell cycle phases have been determined by FACS analysis. Images shown represent western analysis performed, stained and exposed simultaneously to film. Quantification of western analysis can be seen in Fig. S2. Abundance of post-translational modifications was calculated relative to the total amount of that particular protein i.e. the abundance of H3K9me3 was quantified relative to total H3. (b) Shown are cell cycle patterns of modifications and events involved in heterochromatin regulation (H3K9me1/2/3, H4K20me3, H3K9Ac, H3S10ph, HP1α and HP1γ). Western analysis and quantifications were performed as in (A). (c) Cell cycle patterns of H4K5Ac, H4K16Ac, H3K56Ac, H4K20me1/2, H3K79me1/2, SIRT1 and SIRT2. Western analysis and quantifications were performed as in (A). The intensity of signals from westerns of individual modifications does not reflect the levels of each modification in the cell. However, these images reflect the levels of the same individual modification in early and late passage cells. γ-tubulin serves as loading control for SIRT1 and SIRT2.

