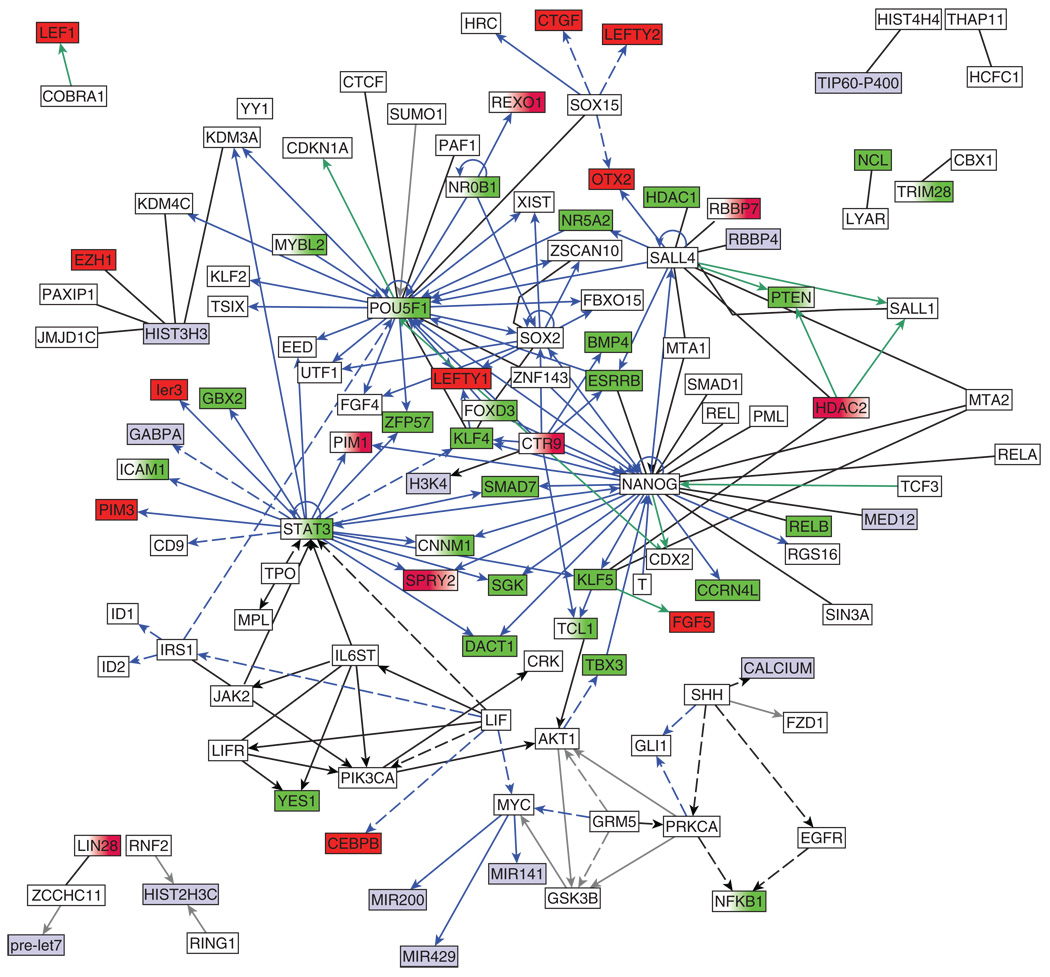
FIGURE 3.
Nodes from the literature-based network shown in Figure 2 are color coded based on changes in expression after Nanog down-regulation using shRNA in mES cells. Green represents down-regulation, red up-regulation. Data for gray nodes was not obtained.

