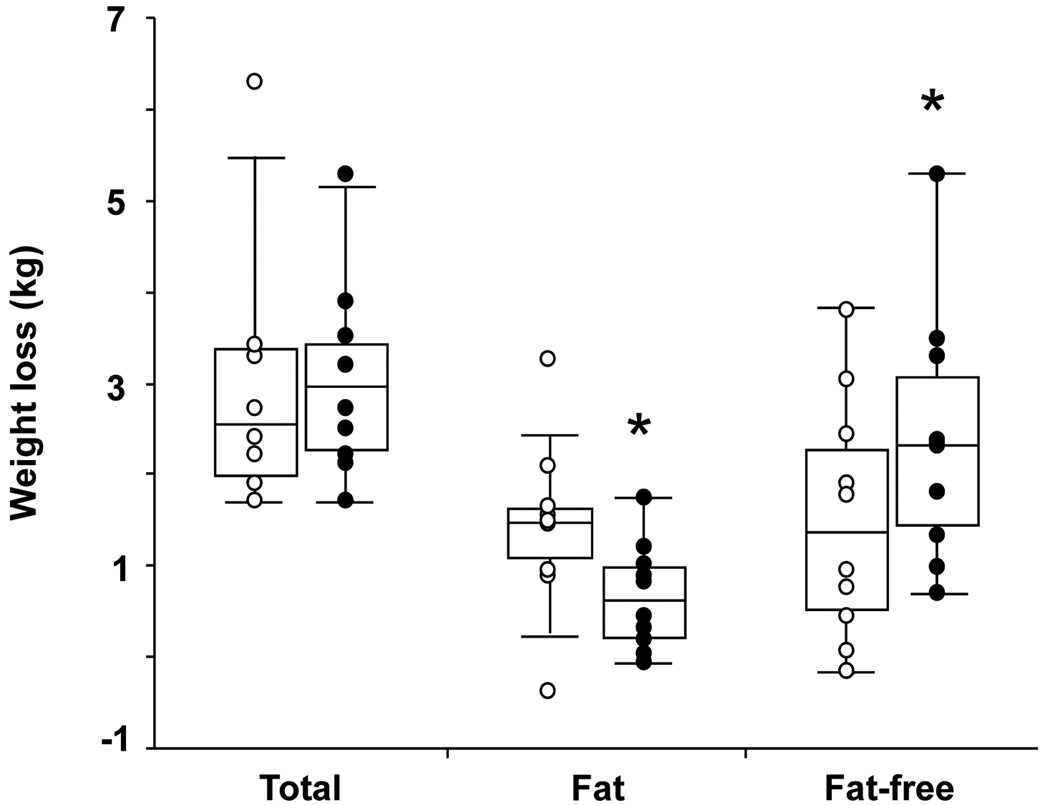
Figure 2. Changes in body weight and composition.
Box plots of the weight loss and its composition during the 8.5-h (open circles) and 5.5-h (solid circles) time-in-bed condition (n=10). Asterisk: significant difference in loss of fat (P=0.043) and fat-free body mass (P=0.002) between the two sleep conditions controlling for study period (initial vs. crossover) and pre-treatment body composition.

