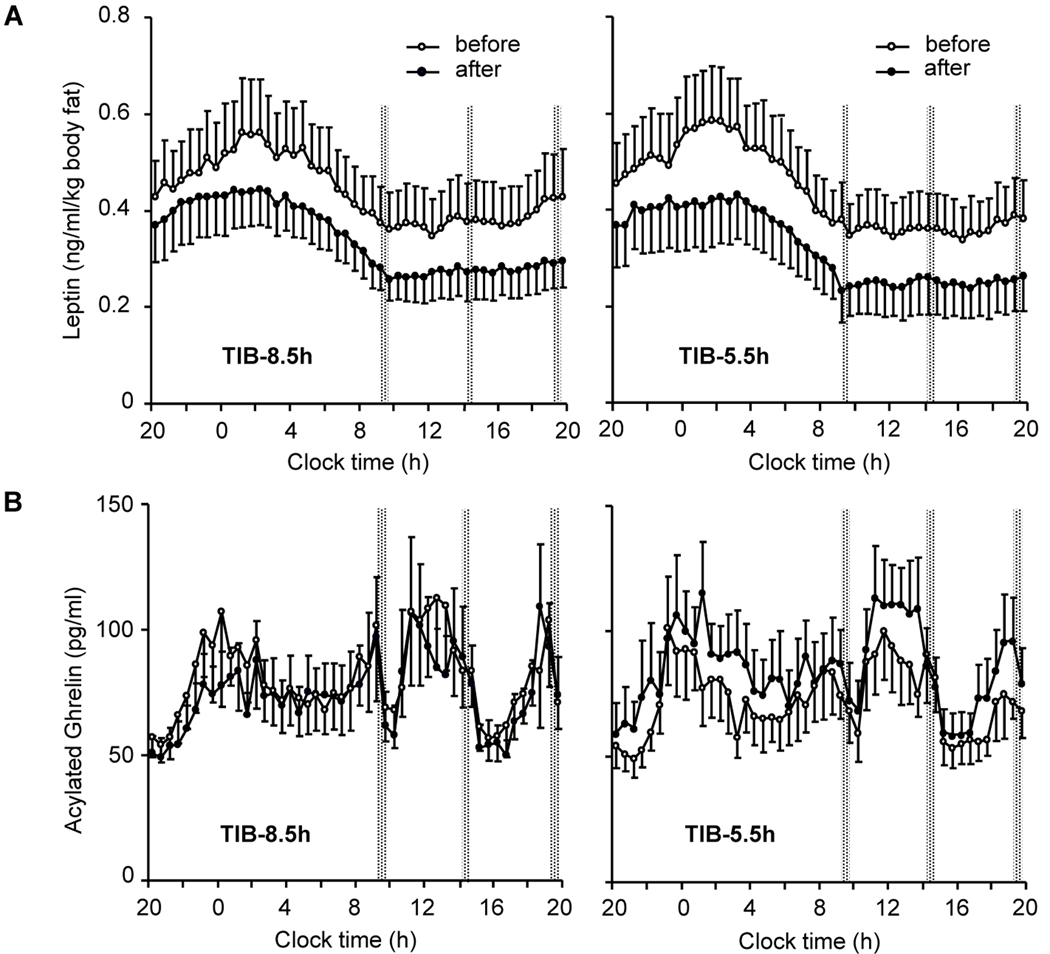
APPENDIX Figure I. Selected metabolic hormone profiles.
A: Mean ± SE (n=10) 24-hour profiles of serum leptin at the beginning (open circles) and the end (solid circles) of the 8.8-h time-in-bed condition (TIB-8.5h, left panels) and 5.5-h time-in-bed condition (TIB-5.5h, right panels) condition; B: Mean ± SE (n=10) 24-hour profiles of serum acylated ghrelin at the beginning (open circles) and the end (solid circles) of the TIB-8.5h (left panels) and TIB-5.5h (right panels) condition. Times of controlled identical calorie intake are marked with vertical dotted bars.

