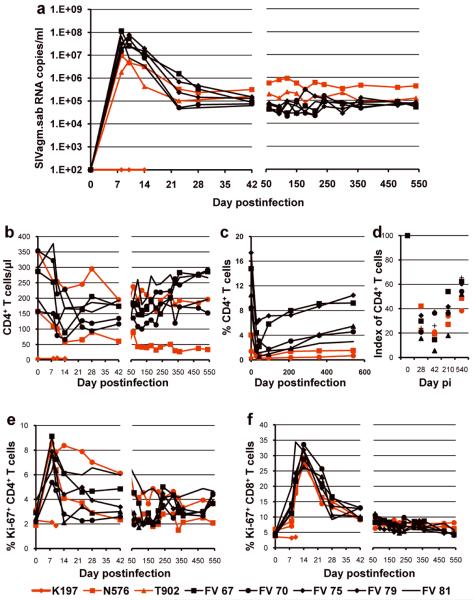
Figure 2. Comparative pathogenesis of SIVagm infection in AGMs and patas.
(a) Dynamics of SIVagm.sab replication in plasma. Peak VL are slightly lower in patas than in AGMs, but chronic viral replication is slightly higher in patas. During chronic infection, viral replication is remarkably stable in both species. (b) Changes in CD4+ T cells in blood: an initial CD4+ T cell depletion of similar magnitude in both species is partially/completely restored in AGMs. The levels of CD4+ T cell restoration are lower in patas. (c) Massive acute mucosal CD4+ T cell depletion occurs in both species, followed by a modest restoration during the chronic infection. When percents of mucosal CD4+ T cells are compared, restoration appears to be more limited in patas. (d) Comparison of indexes of mucosal CD4+ T cells demonstrate that the magnitude of mucosal CD4+ T cell depletion is similar between the two species and that, although the restoration is indeed more limited in patas, the levels of mucosal CD4+ T cells are relatively similar during the chronic infection between the two species. Dynamics of CD4+ (e) and CD8+ T cell (f) immune activation (as defined by changes in the expression of Ki-67) in peripheral blood of SIVagm-infected AGMs and patas. Red symbols and lines denote patas. Black symbols and lines denote the control AGMs.

