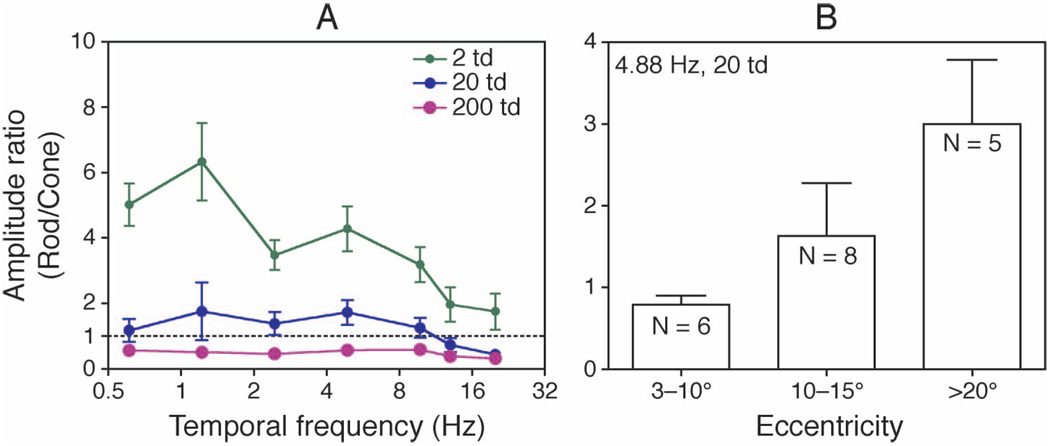
Figure 2.
The ratios of response amplitudes to the isolated rod and cone stimuli. (A) The rod/cone ratios at different temporal frequencies and light levels averaged from all cells (therefore all eccentricities) are plotted, the dashed lines representing equal rod and cone response amplitudes. (B) The rod/cone ratios measured at 4.88 Hz and 20 td with different retinal eccentricity. The rod/cone ratios increased with increasing eccentricity (analysis of variance, p = 0.002). Error bars are standard errors.

