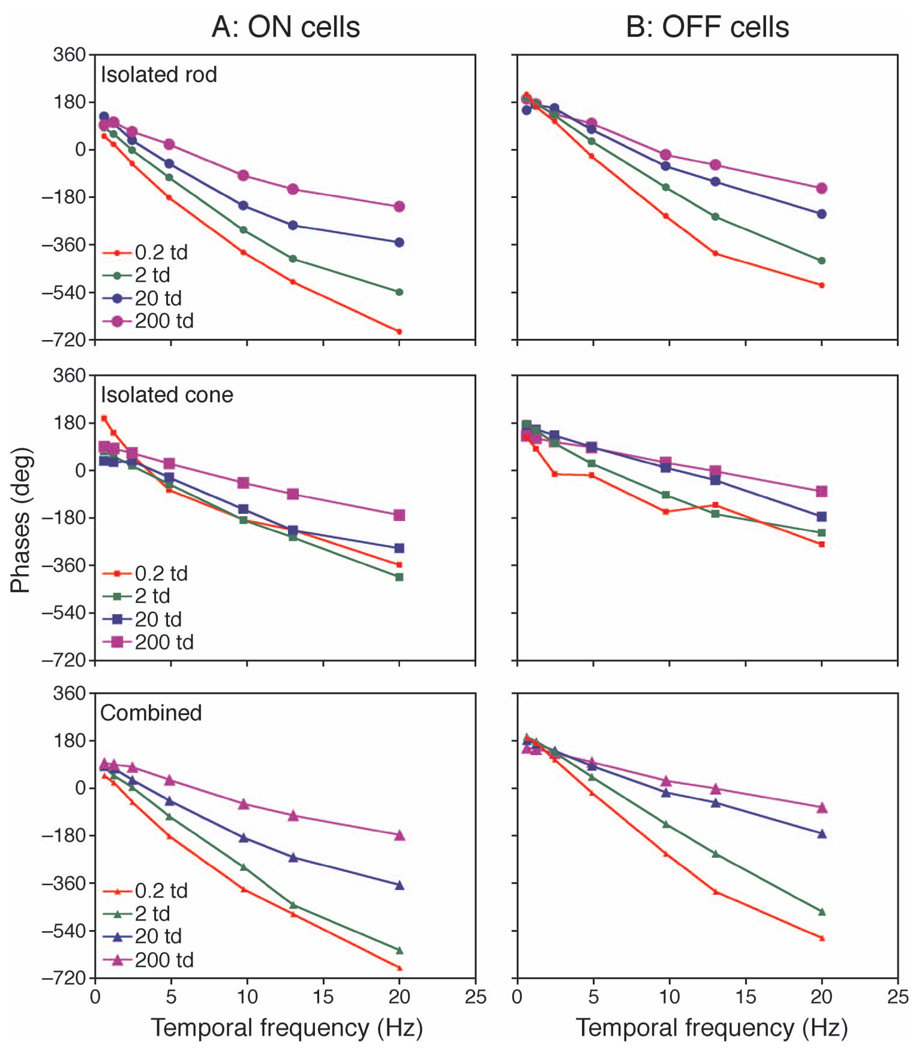
Figure 3.
The averaged phases from the cells that showed strong responses to both the isolated rod and cone stimuli (peak amplitude ≥10 impulses/s). (A) On cells (1 cell at 0.2 td, 6 cells at 2 td, 7 cells at 20 td, and 7 cells at 200 td). (B) Off cells (3 cells at 0.2 td, 9 cells at 2 td, 8 cells at 20 td, and 9 cells at 200 td). Error bars are standard errors.

