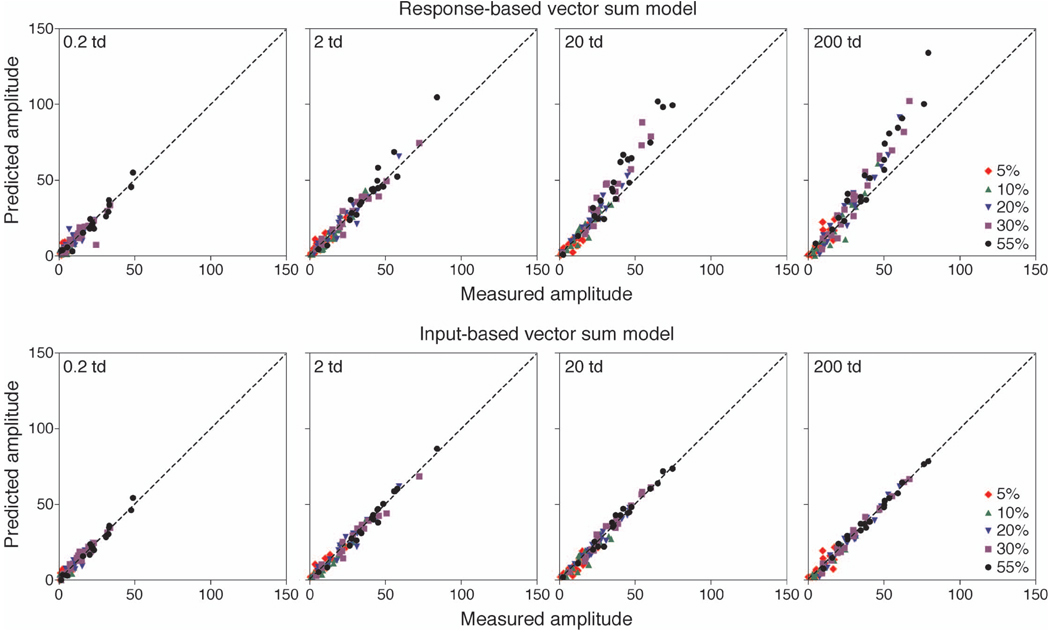
Figure 6.
The comparison between the predicted amplitudes and the measured amplitudes to the combined stimuli from (top) the response-based vector sum model and (bottom) the input-based vector sum model. The dashed lines represent perfect correspondence between the predicted and measured amplitudes.

