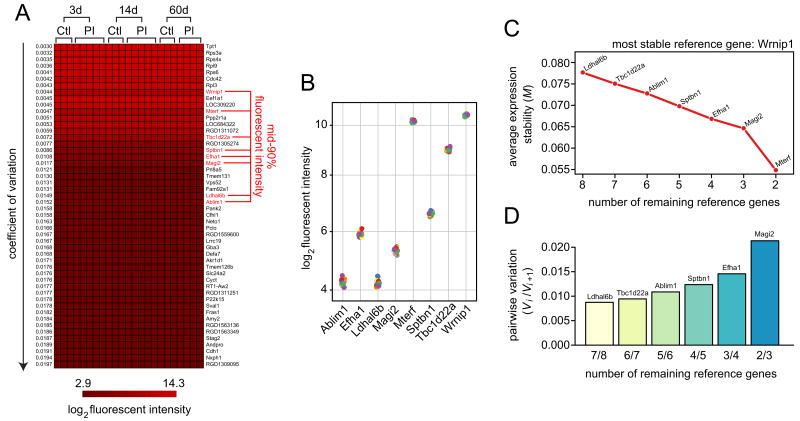
Figure 1. Microarray-based selection of candidate reference genes.
An expression microarray dataset was generated representing rat vocal fold mucosa 3, 14 and 60 days post-injury. Age-matched non-injury controls were included at each time point. A total of 23 arrays (14 post-injury, 9 non-injury controls) were included in the dataset. (A) Heat map showing log2 fluorescent intensity for the 50 genes with the lowest coefficient of variation across all arrays representing both injury and non-injury experimental conditions. Genes are ranked by ascending coefficient of variation. Eight genes exhibited mean fluorescent intensity within the mid-90% of all genes on the arrays; these genes were subjected to further analysis. (B) Distribution of log2 fluorescent intensity for the eight genes of interest identified in panel A. Twenty-three data points are shown for each gene, inclusive of injury and non-injury experimental conditions. (C) Average expression stability of a basket containing the eight genes of interest during stepwise exclusion of the least stable gene (geNorm algorithm). The abscissa reflects the number of genes under consideration throughout the stepwise procedure; the ordinate reflects the average expression stability (M-value) of the remaining genes after exclusion of the least stable gene (indicated by name on the plot). (D) Pairwise variation (Vi/Vi+1) between two sequential normalization factors (NFi and NFi+1) calculated to determine the optimal number of reference genes for accurate normalization (geNorm algorithm). Ctl, non-injury control; PI, post-injury; d, day.

