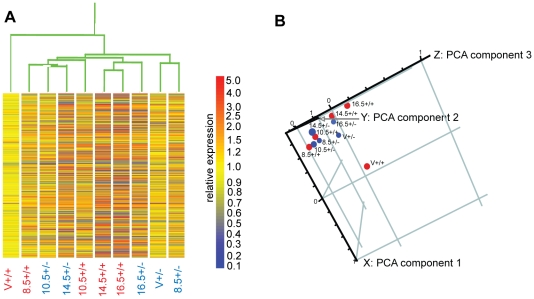
Figure 1. Comparing the Transcriptional profiles of Elf5+/+ and Elf5+/− mammary glands.
A. A condition dendrogram was generated within the Genespring software suite using an average linking clustering algorithm and a Spearman correlation similarity measure. Individual genes are represented by horizontal bars, which are coloured according to their expression level relative to the virgin Elf5+/+ (V+/+) sample. B. Principal components analysis was performed in Genespring on all 10 conditions examined by microarray. Conditions are plotted on a 3-dimensional scatter plot according to their variance from the first 3 components. The conditions were normalised to the V+/+ condition.

