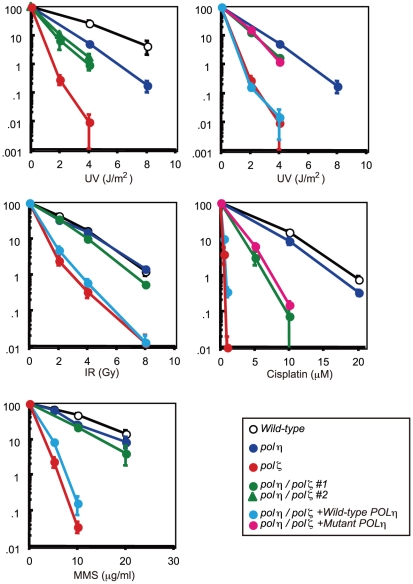
Figure 2. Increased tolerance of polη/polζ cells to various genotoxic stresses, compared with polζ cells.
Colony survival of the indicated genotypes following the indicated genotoxic stresses. Data for the polη/polζ #1 clone are shown in the other figures. Error bars show the SD of the mean for three independent assays.

