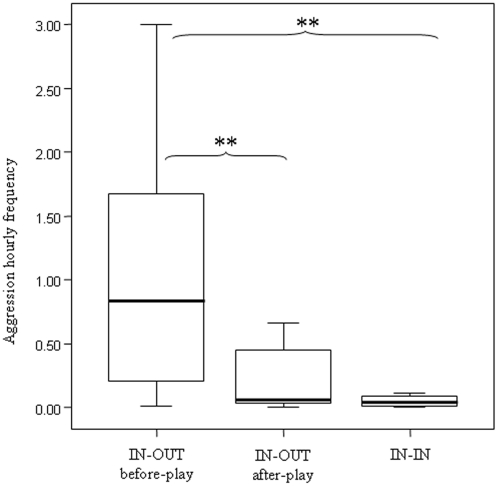
Figure 3. Levels of aggressions between resident and stranger males before and after play.
According to the three conditions, the hourly distribution of aggression frequency is reported as follows: IN-OUTbefore-play (aggressions between resident and outgroup males before play), IN-OUTafter-play (aggressions between resident and outgroup males following play), and IN-IN (aggressions between residents). Solid horizontal lines indicate medians; length of the boxes corresponds to inter-quartile range; thin horizontal lines indicate range of observed values. Only statistically significant values are reported on the figure. Single asterisk (*): p<0.05; Double asterisk (**): p<0.01.

