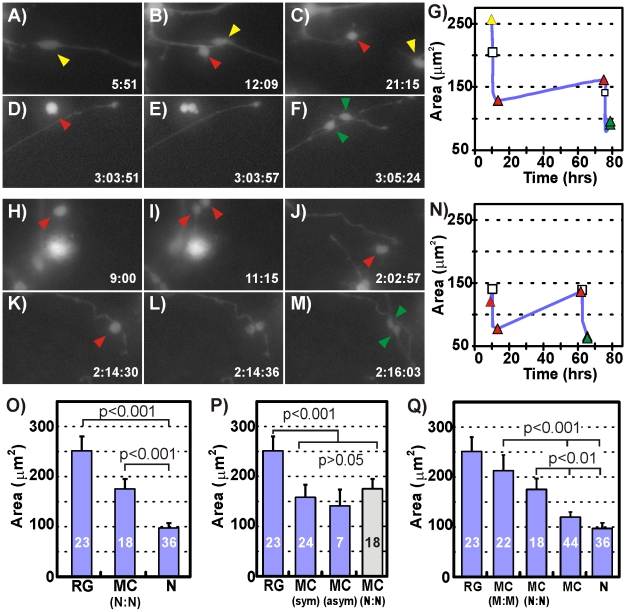
Figure 6. Neurosphere Cultures Utilize a 3-Cell Neurogenesis Hierarchy.
Fluorescence micrographs of a lenti-GFP infected RG (A) dividing asymmetrically (B) to produce a RG (yellow arrowhead) that migrates out of the field of view and a MC (red arrowhead)(C). The MC divides again (D–E) approximately 2 days later producing highly motile neurons (green arrowheads)(F). (G) Somal size comparison for the cell sequence shown in (A–F) details the division of the RG (yellow triangle) into the MC (red triangle). The MC grows slightly over 2 days before it divides again (white square) into 2 neurons (green triangles). Fluorescence micrographs of a lenti-GFP infected MC (H) dividing symmetrically (I) to produce two more MCs one of which migrates out of the field of view (J). The other MC (red arrowhead) continues to grow and migrate until it divides 2 days later (K–L) into two neurons (M). (N) Somal size comparisons for the cells in (H–M) reveals that the daughter MC grows to the size of its mother MC before itself dividing into two neurons. (O) Comparison of the somal areas for all cells shows that the three cell types participating in the 3-cell hierarchy have distinct sizes. (P) A comparison of the somal areas of all RGs, all MCs derived from symmetric (MCsym) and asymmetric (MCasym) division, and neurogenic MCs (MC(N:N)) provides circumstantial evidence that all RG daughters may be neurogenic MCs. (Q) Inclusion of MC-genic MCs and their MC daughters in somal area comparisons and the lack of congruence with the somal areas of other cell types suggest the presence of another MC subpopulation.

