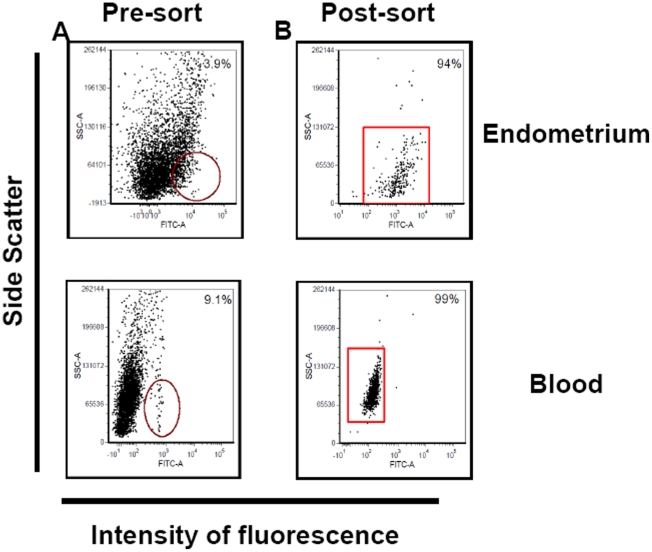
Figure 1. Representative acquisition dot plots for CD14+ cells in endometrium and peripheral blood as determined by flow cytometry.
Shown are analyses for dispersed endometrial cells and peripheral blood mononuclear cells from a cow at ∼Day 230 of pregnancy before (A) and after two rounds of cell sorting (B). The y-axis depicts side scatter characteristics (SSC) to analyze cells on the basis of granularity and the x-axis depicts intensity of fluorescence (FL1) associated with anti CD14. The circles and rectangles in the dot plots identify CD14+ cells targeted for sorting.

