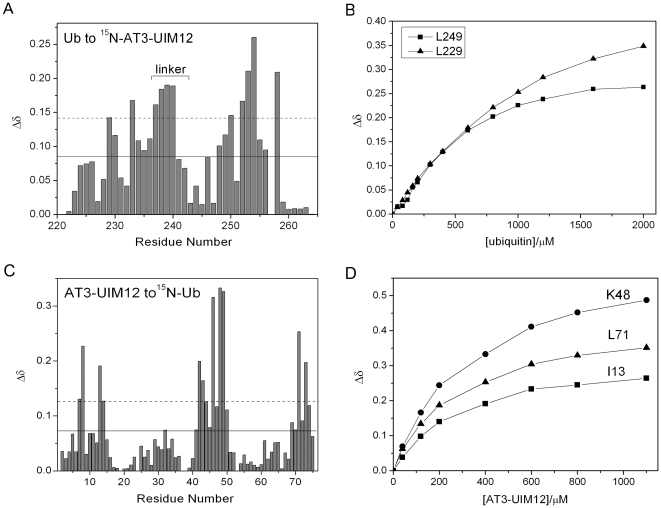
Figure 4. Interaction of Tandem AT3-UIM12 with Ub.
A, Diagram of the chemical shift changes (Δδ) of AT3-UIM12 against residue number at an AT3-UIM12/Ub molar ratio of 1∶2. B, Titration curves for two equivalent residues (Leu229 in UIM1 and Leu249 in UIM2) in tandem AT3-UIM12 upon Ub binding. Note that the Δδ value of Leu249 in UIM2 upon Ub titration reaches the plateau with lower amount of Ub than the corresponding Leu229 in UIM1. C, Diagram of the chemical shift changes (Δδ) of Ub against residue number at an Ub/AT3-UIM12 molar ratio of 1∶2. D, Titration curves for three residues (Ile13, Lys48 and Leu71) in Ub upon GB1-tagged AT3-UIM12 binding. The dissociation constant for the binding of AT3-UIM12 with Ub is listed in Table 1. The solid and dashed lines (A & C) indicate the threshold values of mean and mean plus SD for the chemical shift changes.

