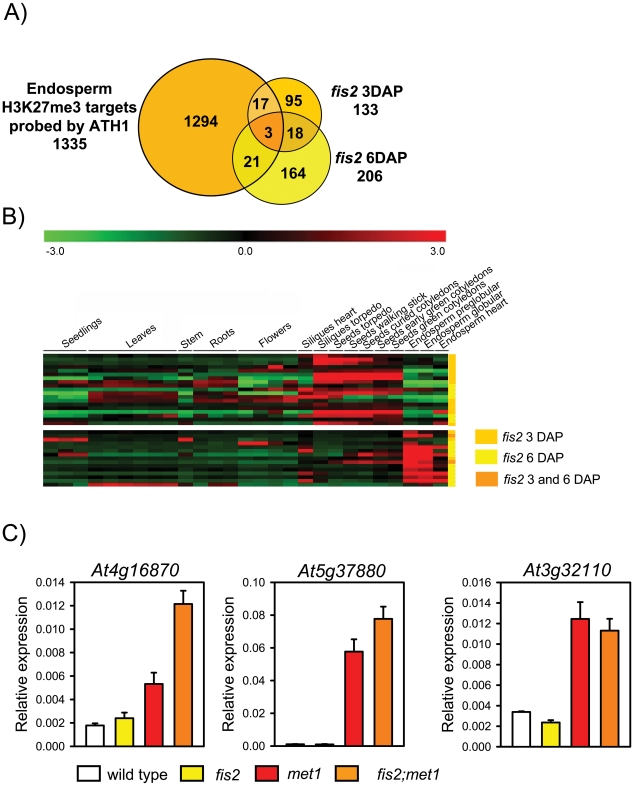
Figure 6. Only Few H3K27me3 Target Genes Are Deregulated in fis2 Mutants.
A) Venn diagram showing overlap of H3K27me3 target genes with genes deregulated in fis2 seeds at 3 DAP and 6 DAP. Only genes present on the ATH1 microarray were included in the analysis. B) Cluster analysis of H3K27me3 target genes that are deregulated in fis2 mutant. H3K27me3 target genes are grouped into two main clusters based on their expression patterns in different domains of the endosperm. Each row represents a gene, and each column represents a tissue type. Tissue types are: seedlings, leaves, stems, roots, flowers, siliques containing seeds with embryos in the heart or torpedo stage, seeds with embryos in the torpedo, walking stick, curled cotyledon, early green, and green cotyledon stage and endosperm derived from seeds with embryos in the preglobular, globular and heart stage. Red or green indicate tissues in which a particular gene is highly expressed or repressed, respectively. Colors at the right side symbolize genes deregulated in fis2 at 3 DAP (orange), 6DAP (yellow), or at both time points (yellow with orange stripes). C) Quantitative RT-PCR analysis of TEGs in wild-type, fis2/FIS2, met1/MET1 and fis2/FIS2;met1/MET1 seeds. Error bars, s.e.m.

