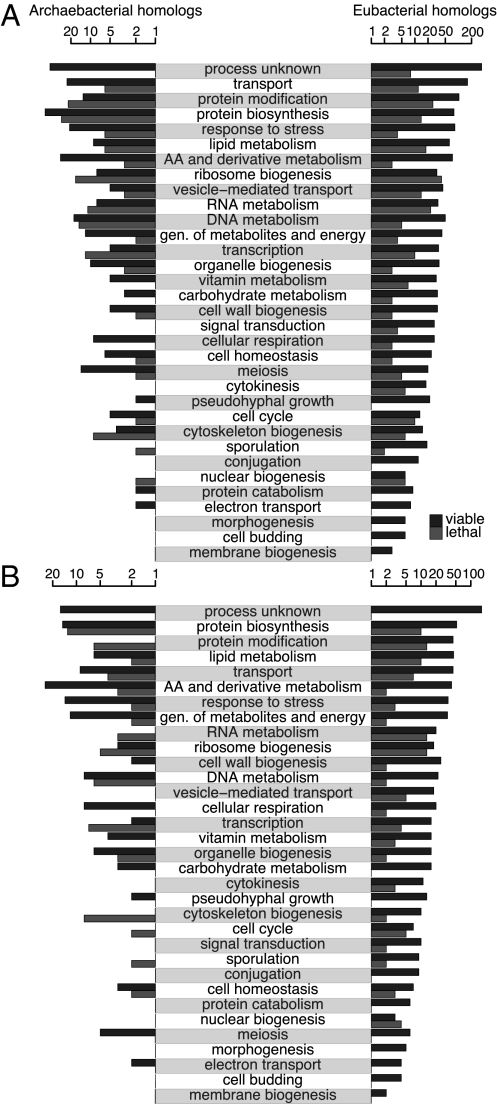
Fig. 1.
Distribution of homologs for yeast genes. Homologs are listed by homology domain, functional category, and deletion phenotype. (A) Best-hit domain. (B) Unambiguous hits, with homology only to one of the two prokaryotic domains. Light bars represent lethal genes and dark bars represent viable genes in each domain. Note that the number of genes is plotted on a log axis.

