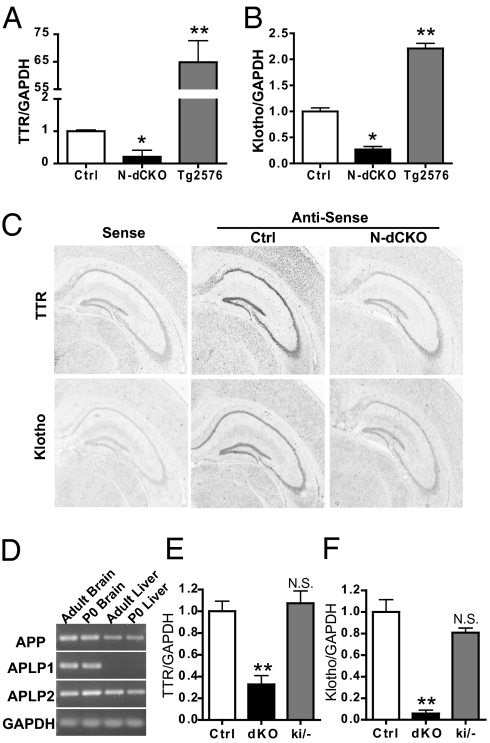
Fig. 4.
Analysis of TTR and Klotho expression. Relative qRT-PCR analysis of TTR (A) and Klotho (B) mRNA levels from the hippocampi of 2-mo-old control (Ctrl), N-dCKO, and Tg2576 APP transgenic mice (n = 3). (C) Representative in situ hybridization images of TTR and Klotho from littermate APLP2−/− control (Ctrl) and N-dCKO brain sections (sense, hybridization with a sense probe as a negative control; antisense, hybridization using corresponding antisense probes). (D) RT-PCR analysis of APP, APLP1, and APLP2 expression in adult and P0 brain and liver. GAPDH was used as an amplification control. Relative qRT-PCR analysis of TTR (E) and Klotho (F) mRNA levels in P0 livers from control APLP2 null (Ctrl), APP, and APLP2 dKO and APPsβ ki mice on APLP2 null background (ki/−). Data are the mean ± SEM of two independent experiments, each with three samples per genotype. *P < 0.05; **P < 0.01. (N.S., nonsignificant, Student's t test).

