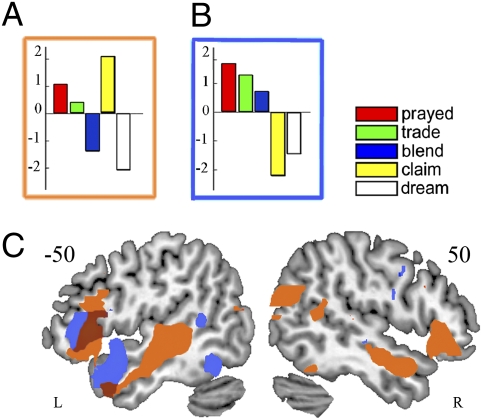
Fig. 2.
Selected MLM eigencomponents and their overlay. Bar graphs are in the unit of the beta images. (A) Component dissociating embedded from nonembedded words; (B) component dissociating IRP from non-IRP words; (C) overlay on a canonical brain of the embeddedness (orange) and IRP (blue) components, shown at t > 1, with the overlap between them in purple.

