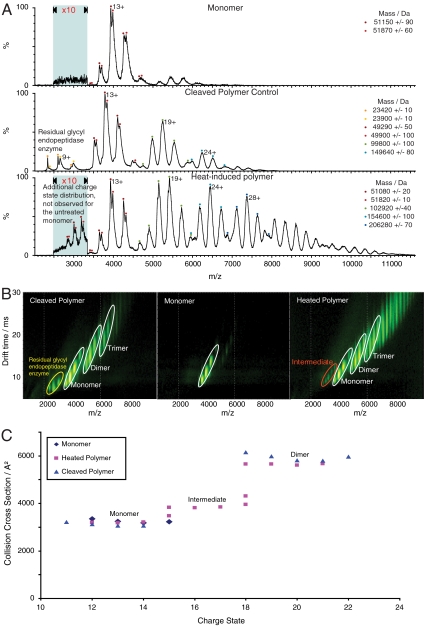
Fig. 5.
α1-antitrypsin polymers studied by IM-MS. (A) Mass spectra of M α1-antitrypsin monomer, the heat-induced polymer, and P9-P10 reactive loop-cleaved polymer. The mass spectrum of the monomer has a charge state distribution centered on the 13+ ion (upper spectrum). The mass spectrum of the reactive loop-cleaved polymer has four charge state distributions (middle spectrum). The peaks at low m/z are attributed to residual enzyme and the series of peaks at 4,000 and 5,250 and 6,250 m/z represent the cleaved monomer, dimer and trimer respectively. Similar spectra were observed for the heat-induced sample (lower spectrum). However, this spectrum exhibits a second monomer population with higher charge states (15+ to 18+), which are consistent with the polymerogenic intermediate. (B) Ion mobility drift times observed for the M α1-antitrypsin monomer, the heat-induced polymer, and reactive loop-cleaved polymer (corresponding mass spectra shown in A). The monomer and polymer species are labeled and highlighted with white ellipses, the intermediate with a red ellipse, and the cleavage enzyme with a yellow ellipse. (C) Drift times from (B) converted into a collision cross sectional plot. The monomer collision cross sections for all the samples are almost identical and similarly the collision cross sections for the cleaved polymer and heat-induced polymer dimers also overlap. The intermediate in the heat-induced polymer sample shows an expanded collision cross section relative to the monomer and maintains the same electrophoretic relationship with the dimer as that observed on nondenaturing PAGE (Fig. 4C).

