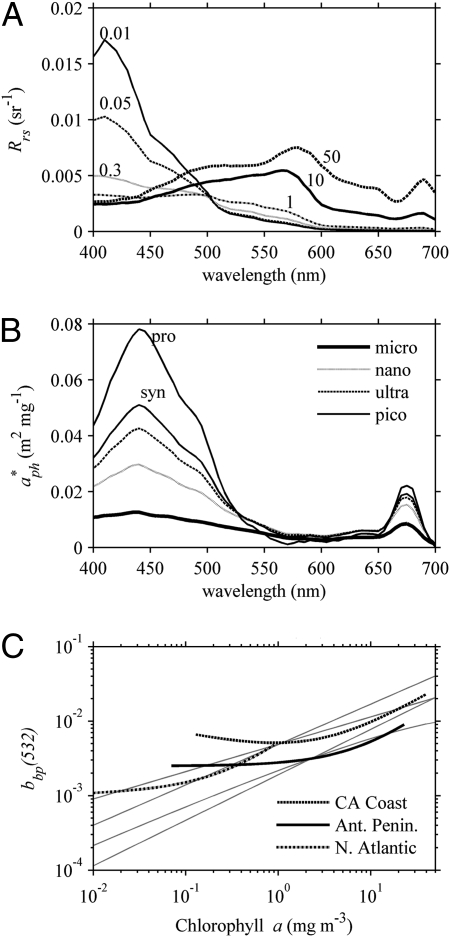
Fig. 2.
(A) Example relationship of how remote sensing reflectance, Rrs, changes from blue peaked to green peaked with increasing chlorophyll. (B) The spectral shape and magnitude of chlorophyll-normalized absorption, a*ph, changes for different sizes of phytoplankton (30). (C) The bio-optical relationships between particulate backscattering and chlorophyll vary either linearly or log linearly, depending on the region. The straight lines represent several different bio-optical models (4, 37, 38).

