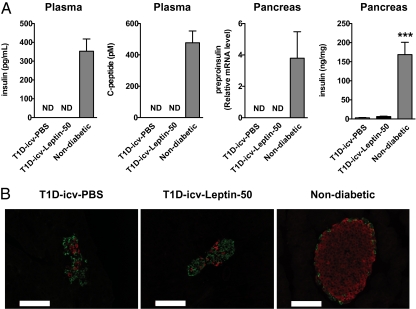
Fig. 1.
Pancreatic insulin profiles in STZ-treated mice. (A) Plasma insulin and C-peptide as well as pancreatic preproinsulin mRNA and insulin levels in T1D-icv-PBS and T1D-icv-Leptin-50 mice 10 d following stereotaxic surgery and in age-matched nondiabetic control mice. (B) Representative distribution of cells expressing insulin (red) and glucagon (green) in the pancreas of mice shown in A. (Scale bar = 100 μm.) Error bars represent SEM. Statistical analyses were done using one-way ANOVA (Tukey's posttest) (n = 5–7 in each group). ***P < 0.001 vs. T1D-icv-PBS mice. ND, below the threshold of detection.

