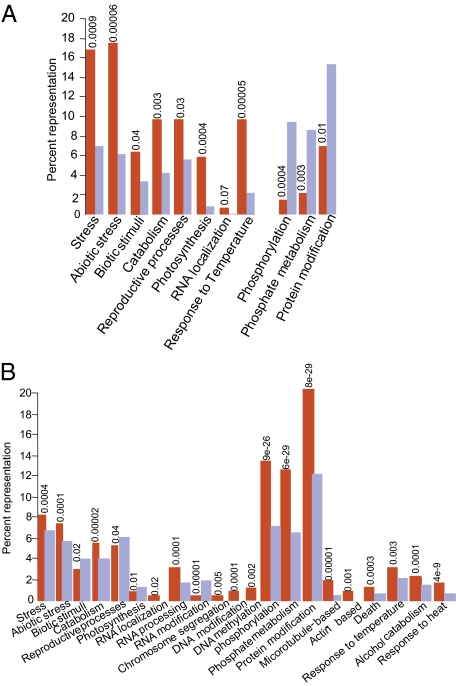
Fig. 6.
Enrichment of SUMO substrates in proteins involved in specific biological processes. (A) Putative SUMO substrates identified by yeast two-hybrid analysis. (B) Putative SUMO substrates identified computationally as containing hpSAS. The y axis represents the percentage of all SUMO substrates (red columns) or of whole Arabidopsis proteome (blue columns); the x axis represents specific biological processes. P values are given above each category and indicate the probability with which this pattern would be expected to occur at random. P < 0.05 are highly significant.

