Fig. 3.
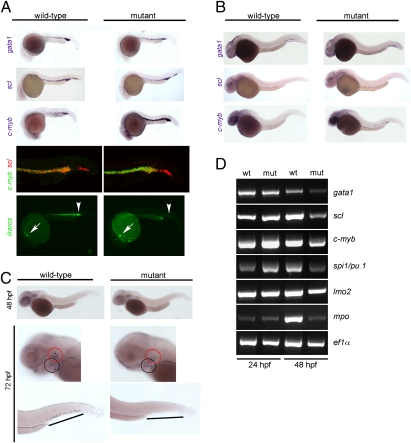
Characterization of primitive hematopoiesis. (A) Whole-mount RNA in situ hybridizations (WISH) were performed at 24 hpf with probes specific for scl (merge composed of three pictures), gata1, and c-myb. Hybridizations using single probes are shown in the top three panels. A double-fluorescent in situ hybridization for c-myb (green fluorescence) and scl (red fluorescence) is shown in the penultimate panel (merge of 22 optical slices at 5-μm thickness for wild-type and 20 slices for mutant embryos; Fig. S3 has additional data). The expression of ikaros was visualized using an ikaros:eGFP transgenic reporter (bottom panel). Note the normal number and fluorescence intensity of embryonic macrophages located in the anterior part of the embryos (arrows) and the diminished signals in the caudal hematopoietic tissue (CHT) and intermediate cell mass (ICM) of mutants (arrowheads); the embryonic macrophages are highly motile cells (Movies S9 and S10). (B) WISH analyses at 36 hpf using the indicated probes. All photographs are composites of three pictures, with the exception of the gata1 hybridization of mutant embryo, which is composed of four pictures. (C) WISH analyses for c-myb expression at the indicated time points. The photographs for the 48-hpf time-point are merged from three pictures. In the images taken at 72 hpf, the pharyngeal arches are marked with a black circle, and the thymic rudiment is marked with a red circle (Middle); the hematopoietic tissue in the tail regions (Bottom) is indicated by lines. (D) Gene-expression analysis in c-myb mutants. RT-PCR was performed at the indicated time points for the indicated genes; elongation factor 1 α (ef1α) serves as a control for cDNA integrity and a standard.

