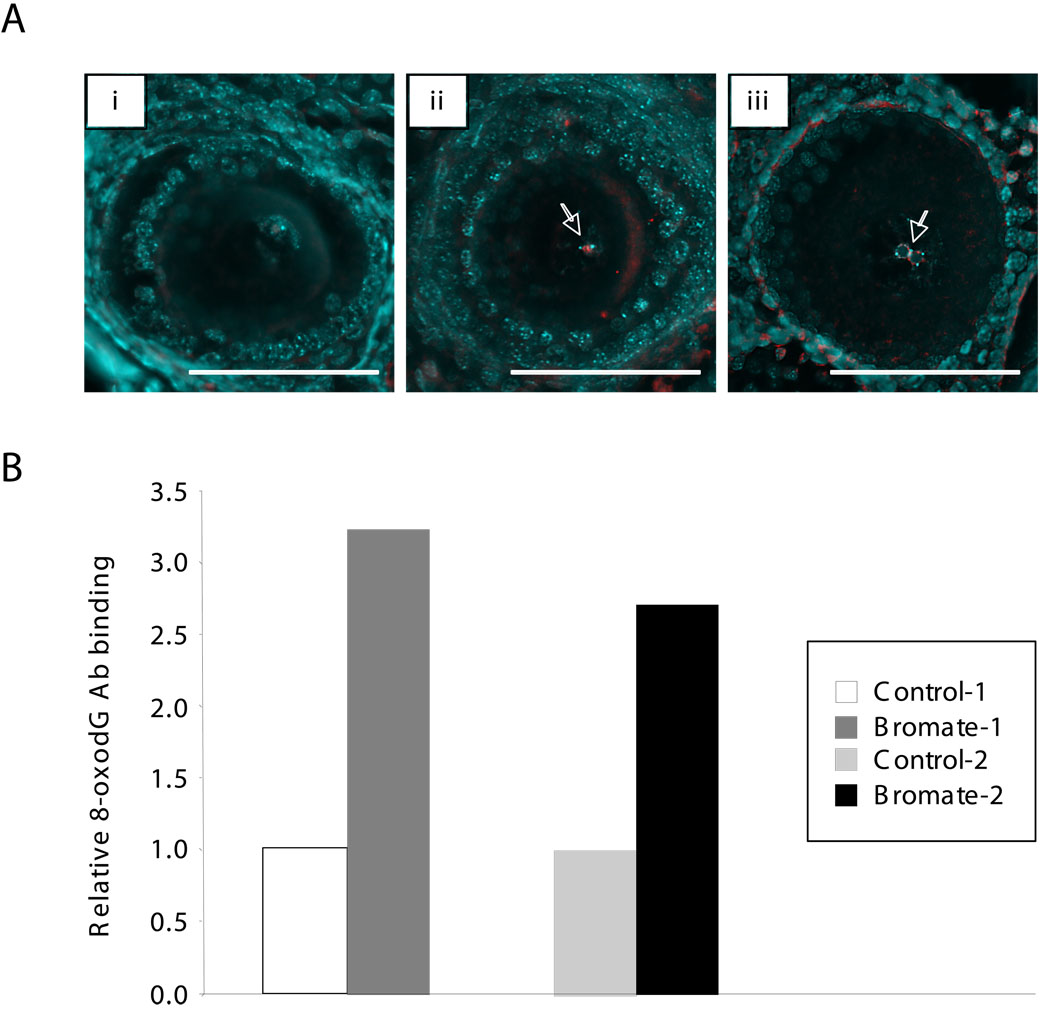
Fig. 1.
8-oxoG in the ovaries of untreated and bromate-treated mice. Panel A. 8-oxoG in the oocytes of untreated and bromate-treated mice. Sections of the ovaries of untreated mice (i) and bromate-treated animals of the same age (ii and iii) were stained with antibodies to 8-oxoG as described in the Materials and Methods. The DNA was stained with Hoechst 33258. The 8-oxoG staining regions are shown in red with the DNA shown in blue. Bars = 100 microns. The white arrows indicate 8-oxoG-positive signals in the oocyte nuclei. Note that occasional cytoplasmic staining is also seen in bromate-treated ovaries, most likely due to oxidation of mitochondrial DNA and RNA. Note that the oocyte shown in (iii) demonstrates the typical perinucleolar clumping of DNA sometimes seen in oocytes of this stage. The non-uniform distribution of 8-oxoG seen in the nuclei of some cells may reflect the known clustering of 8-oxoG lesions in the human genome (Ohno, et al., 2006). Panel B. Relative 8-oxoG levels in the ovaries of 2 bromate-treated mice and their age matched controls raised on unadulterated water. The 8-oxoG levels in treated animals are expressed relative to the amount of 8-oxoG in the appropriate age-matched control animals. Each bar represents the average of 3 independent determinations.

