
Figure 5. Effects of ds or ft misexpression on MT dynamics.
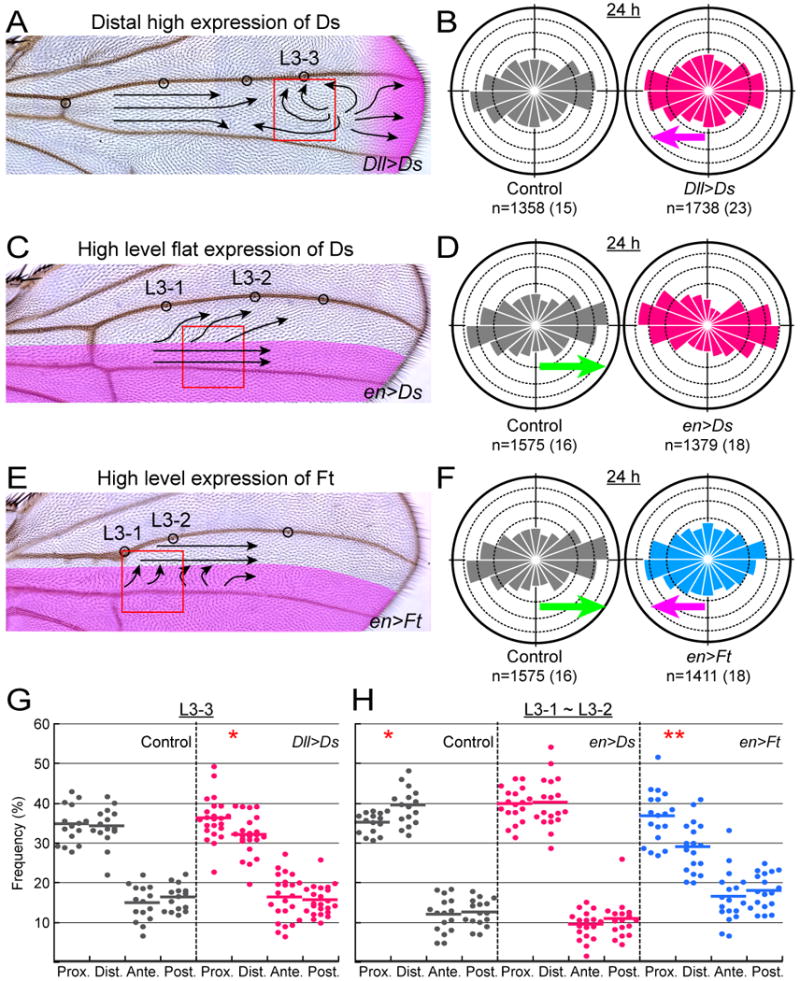
(A, C, and E) Adult wings of animals in which ds or ft was misexpressed or overexpressed. The presumptive expression domains are shaded in magenta (see also Movies S5 and S6). Arrows represent the hair polarity on the dorsal surface. (A) ds was ectopically expressed in cells along the distal wing margin. (C and E) ds and ft, respectively were overexpressed in the posterior compartment.
(B, D, and F) MT growth at 24 h APF in the control animals (gray) and in the animals in “A,” “C,” and “E” (red and cyan, respectively). Green arrows, magenta arrows, and numbers below the diagrams are as explained in the legends of Figures 2B and 4C.
(G and H) The directional preference of EB1-GFP comets at 24 h APF at location L3-3 (G; red box in “A”) and at the location between L3-1 and L3-2 (H; red boxes in “C” and “E”). Gray datum points were collected from the control animals, whereas red and cyan points were from animals in “A,” ”C,” and “E,” respectively. Statistical significance of the directional preference between proximally oriented MTs and distally oriented MTs is indicated with asterisks (*: p < 0.05; **: p < 0.01; Wilcoxon signed-rank test). Actual p-values were 0.01614 (Dll>Ds in “G”), 0.01286 (control in “H”), and 0.003745 (en>Ft in “H”).