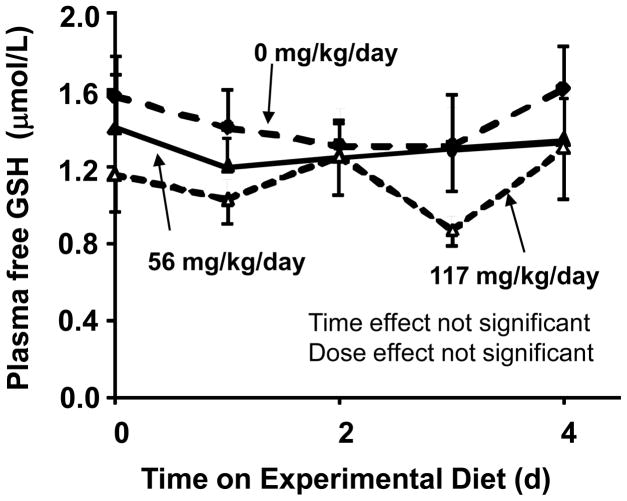
Fig 5. Dose response of SAA repletion on free GSH in human fasting plasma following SAA repletion.
The study protocol is as outlined in Figure 1. Data shown are derived from fasting plasma samples obtained at morning time points from baseline (completion of SAA depletion period, closed circle, dotted line) and for the next 4 days during repletion with diets providing either 56 mg·kg−1·d−1 SAA (closed triangle, solid lines: n=8) or 117 mg·kg−1·d−1 SAA (open triangle, dotted line: n=5). No significant effect of SAA dose was observed by two-way repeated measures ANOVA. Data are expressed as mean ± SEM.

