
Fig 3.
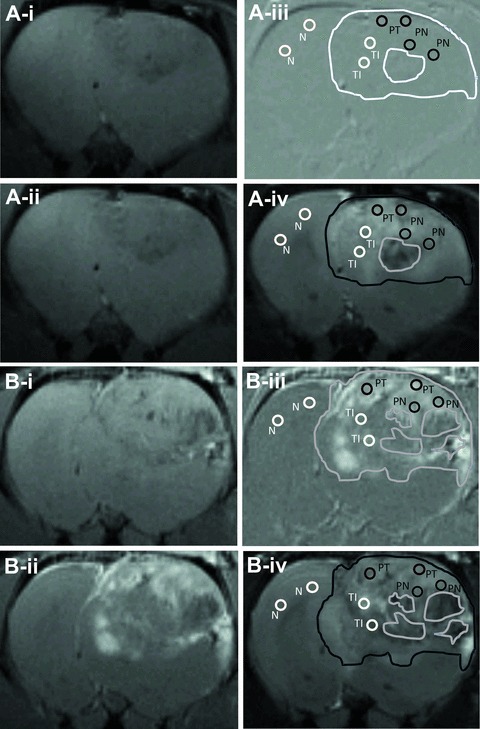
T1 weighted MR images obtained before and 2 hrs after injection of control IgG (A-i and -ii) and VEGFR2-mAb (B-i and -ii) -linked mMRI agents, with corresponding difference images (iii) and T2-weighted images obtained before injection of the contrast agent (iv). Representatives of ROIs in each group are depicted as circles, using for calculating signal intensities and probe concentrations in Figure 4. The edges of the tumours were also lined out, as well as the necrotic areas inside the tumours. Contralateral normal tissue is labelled as N, tumour periphery as PT, periphery around the necrotic area as PN, and tumour interior with less positive signal as TI.