
Fig 5.
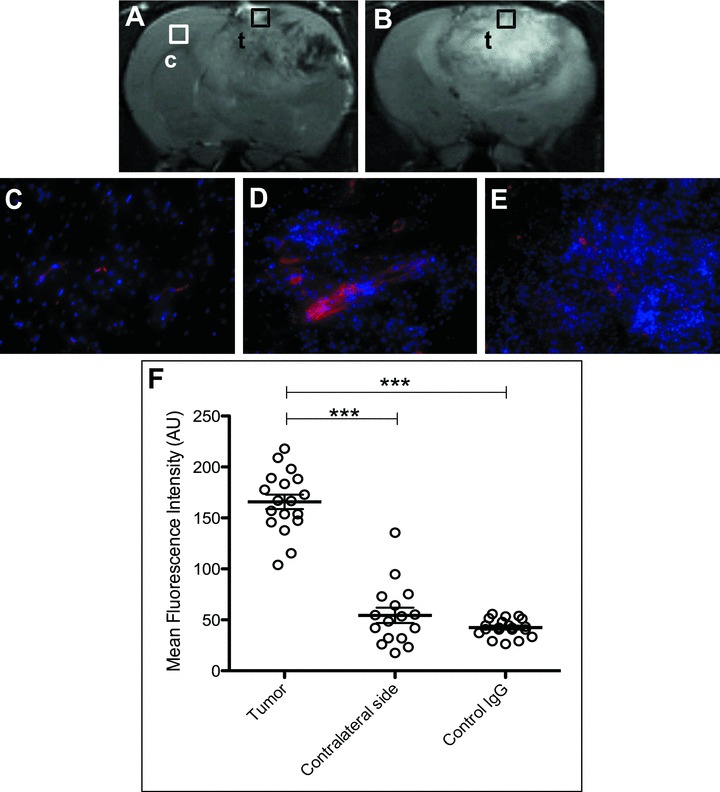
(A) and (B) are the representative T2-weighted images from rats injected with the VEGFR2 probe or the control-IgG contrast agent, respectively. Fluorescence detection of the probe was made in either contralateral brain (C), or glioma tissue (D) at 2 hrs following administration of the VEGFR2 probe, or in glioma tissue (E) at 2 hrs after administration of the control-IgG contrast agent. The tissue locations are indicated by square boxes, ‘c’ for contralateral brain and ‘t’ for tumour. The biotin groups from the contrast agents were stained with Cy3-labelled streptavidin (red fluorescence), and nuclei were stained with DAPI (blue fluorescence; 20× magnification). (F) Mean fluorescence intensities for the VEGFR2 probe injected in rats in the tumour region (as in D), for VEGFR2 probe injected rats in contralateral brain tissue (as in C), or for control IgG injected rats in the tumour region (as in E). ***P < 0.01 indicates significance between (D) and (C), or between (D) and (E). Statistics were done using ANOVA with a Bonferroni’s multiple comparison test.