
Fig 7.
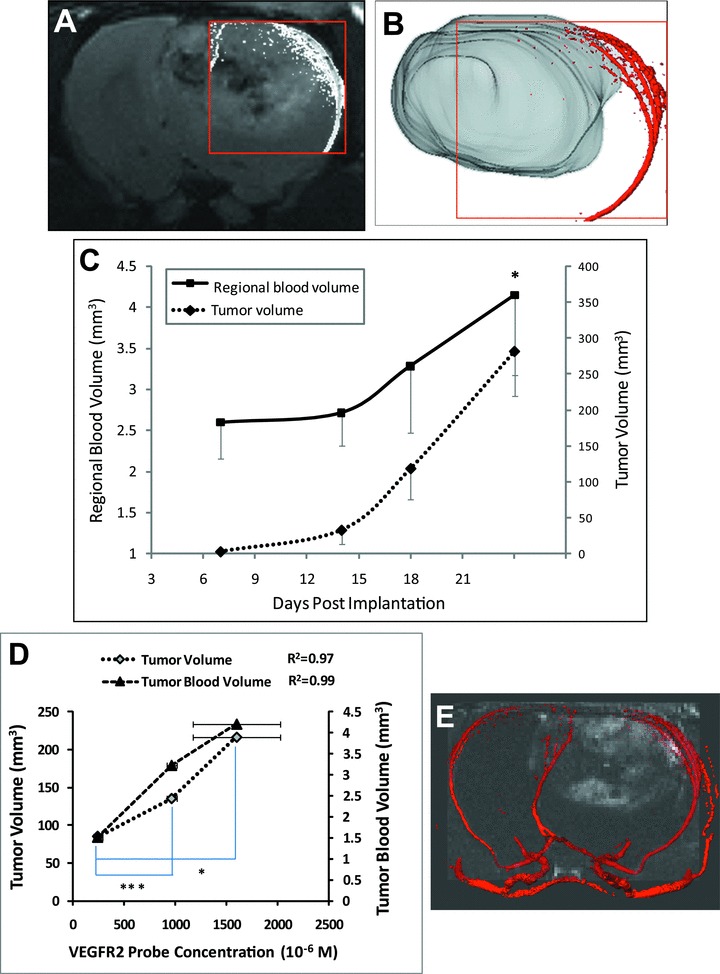
(A) A representative tumour vascular MR angiogram overlaid with a T2-weighted MR image (transverse orientation) of a C6 glioma. (B) 3D vasculature image (obtained from MRA) superimposed on a 3D rendered image of a C6 glioma (using Amira). (C) Increases in tumour blood volume with corresponding increases in tumour volume during the tumour growth time course. The data are represented as the mean ± S.D. *P < 0.05, by a Student’s t-test, indicates a significant difference between days 24 and 7. (D) Increases in VEGFR2 expression is related with increases in tumour and tumour blood volumes. VEGFR2 expression is indicated by VEGFR2 probe concentration which was calculated as differences in T1 rates from 2 hrs after injection of the probe and pre-injection datasets. *P < 0.01 and ***P < 0.0001 (Student’s t-test) indicates significance differences in VEGFR2 levels between rats (three ROIs from each) which have the most and the least tumour volumes, and between those which have the middle and the least tumour volumes, respectively. R2 indicates the linear relationship between VEGFR2 probe concentration and either tumour volume, or tumour blood volume. (E) Reconstructed MR angiography data of the middle cerebral arteries in the tumour region (right) and contralateral brain tissue (left) was superimposed on a difference MR image (obtained from T1-weighted images between 2 hrs after injection and before injection of the VEGFR2 probe; also shown in Fig. 3B-iii).