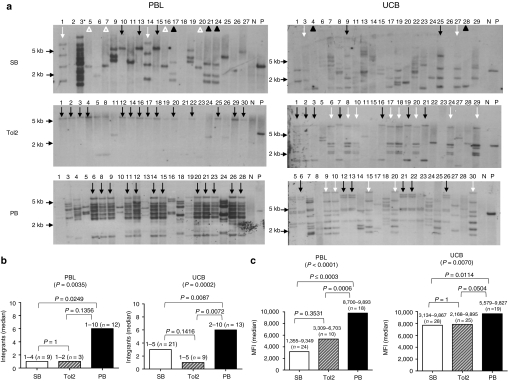
Figure 3.
Molecular analysis of integration in both PBL- and UCB-derived T-cell clones after transfection with SB, Tol2, and PB transposons. (a) Southern hybridization of genomic DNA isolated from DsRed+ T-cell clones with a DsRed probe. PBMNCs and UCBMNCs derived from identical donors were isolated and nucleofected with 5 µg of DsRed transposon-containing vector and 5, 10, or 15 µg of transposase-expressing vector. Three weeks after nucleofection, cells were pooled and sorted for DsRed expression. DsRed+ cells were subsequently cloned by limiting dilution and used for Southern hybridization analysis. Ten µg of genomic DNA extracted from each T-cell clone (clone identification # is shown) was digested with EcoRI and BamHI over night at 37 °C. Ten micrograms of genomic DNA from mock nucleofected T cells with or without 6 pg of transposon plasmid was used as positive and negative controls, respectively. Genomic DNA fragments were separated by electrophoresis through a 0.9% agarose gel and transferred to a Hybond membrane (GE Healthcare, Piscataway, NJ). A radiolabeled probe specific for a portion of DsRed was created by random priming. Probe hybridization was performed in 0.2 mol/l NaHPO4 pH 7.2/1 mmol/l EDTA/1% bovine serum albumin/7% sodium dodecyl sulfate at 65 °C overnight. Blots were subsequently washed three times and exposed to film. Identical symbols indicate the clones with similar patterns of integrants. PB: 12 (~10 bands) out of 22 clones in PBL, 5 (~7 bands, white arrow) and 6 (~5 bands, black arrow) out of 22 in UCB; Tol2: 14 (~1 band) out of 22 PBL, 8 (~5 bands, white arrow), and 7 (~ 2 bands, black arrow) out of 22 UCB; SB: 4 (~1 3-kb band, white triangle), 3 (~3 bands, black triangle), 3 (~1 5.5-kb band, black arrow), and 2 (~4 bands, white arrow) out of 21 PBL, 2 out of 22 UCB with three different banding patterns. Asterisk in PBL-SB clone 3 indicates that this clone was actually derived from PB-transfected T cells confirmed by linker-mediated PCR. One of the two representative data are shown. (b) Median number of integrants per clone. The number above each bar indicates the minimal and maximal number of integrants. (c) Median expression of MFI per clone. The number above each bar indicates the minimal and maximal MFI. MFI, mean fluorescence intensity; N, negative control; n, number of clones analyzed; P, positive control; PBL, peripheral blood lymphocytes; UCB, umbilical cord blood.

