
Figure 1.
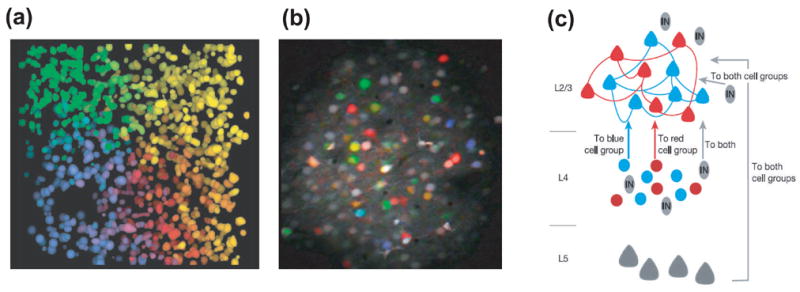
Single-cell resolution orientation maps from (a) a pinwheel in cat visual cortex [42], and (b) rat visual cortex [38**]. Cells are colored according to their preferred orientation. In (a), ~1,000 cells from nine different depths are overlaid. Cells are arranged up to the very center of the pinwheel. In (b), cells in one depth are displayed. Even neighboring cells are tuned to different orientations. (c) In rat visual cortex, relatively independent subnetworks are embedded in larger-scale functional architecture [31*]. Excitatory connections from layer 4 to layer 2/3 and within layer 2/3 define subnetworks of selectively interconnected neurons (red or blue). The excitation from layer 5 (gray triangles) and inhibition from layers 2/3 and 4 adaptive interneurons (IN, gray ovals) does not respect the subnetworks.