
Fig. 1.
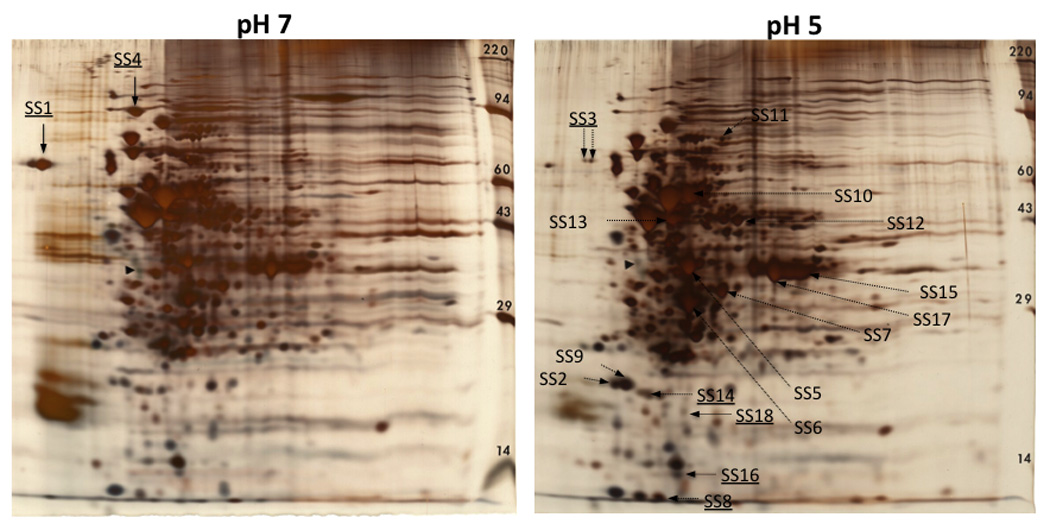
2D protein patterns of S. sobrinus 6715 grown to pH 7 and pH 5 steady-state levels. The silver-stained proteins with enhanced expression at pH 5 (fold-change ≥ 1.5) that were identified by Q-TOF MS/MS are indicated in the pH 5 gel image, and proteins that were enhanced at pH 7 (fold change ≥ 1.5) are indicated in the pH 7 gel image. Underlined spot ID labels indicate proteins that were subjected to Q-TOF MS/MS analysis but the results failed to meet the criteria for confident identification. Refer to Table 2 for name and description of identified proteins. The filled triangle indicates tropomyosin (33 kDa, pI 5.2) loaded as an internal control.