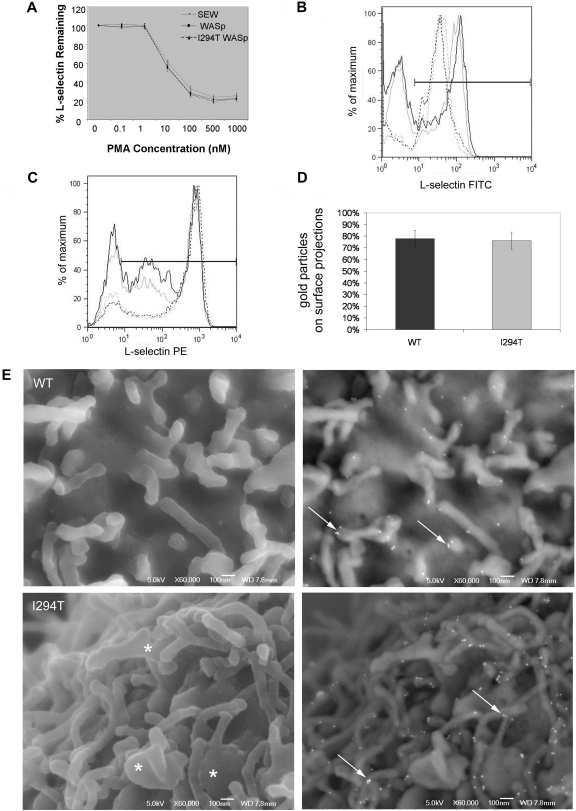
Figure 6.
L-selectin shedding and microvillar localization is normal in WASpI294T 300.19 cells. (A) Surface levels of L-selectin were measured by flow cytometry after incubation of cell lines with increasing concentrations of PMA. Normal shedding was induced in all cell lines tested. (B) Surface levels of L-selectin on purified T cells were measured. Representative plots from 1 of 3 experiments are shown. Black lines represent WASpI294T patient cells; gray lines, healthy control cells before (solid lines) and after (dashed lines) incubation with anti-CD3/CD28 beads. The y-axis label “% of maximum” is a normalized measure of the cell count to facilitate overlay comparisons. (C) Surface levels of L-selectin were measured on T cells before (solid lines) and after (dashed lines) incubation with 30μM sheddase inhibitor (Ro-31-9790). Black lines represent WASpI294T patient cells; gray lines, healthy control cells. All error bars represent SD. (D) Surface L-selectin was labeled using immunogold and imaged by FESEM using a JEOL 6700F FESEM and JEOL software. Adobe Photoshop was used for image analysis (crop, image size, and brightness/contrast functions only). Each cell was scored to determine the positioning of individual gold particles on cell body or surface projections. Histogram demonstrates equal distribution of L-selectin on microvilli. (E) FESEM micrographs of WASpWT and WASpI294T 300.19 cells demonstrating surface topography and L-selectin distribution. Secondary electron images detailing morphology are shown in left panels. Dysmorphic, broad microvilli are visible in WASpI294T cells (asterisks). Right panels show backscatter images to detail gold labeling. L-selectin is clearly located and clustered at the tips of microvilli in both WASpWT and WASpI294T cells (arrows). Scale bars represent 100 nm.

