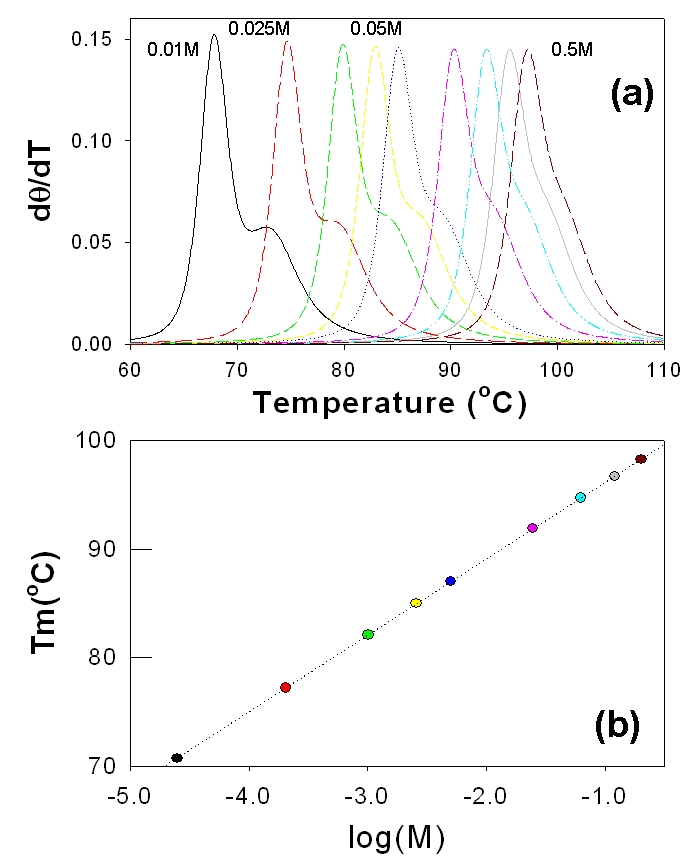
Figure 3.

Temperature effect of Melting profiles: Plots of the melting profiles of the Opossum sequence of the βglobin gene family as a function of salt concentration (a). The plot of the melting temperature (Tm) as a function of the log (concentration) follows a liner relationship (b).
