Figure 5.
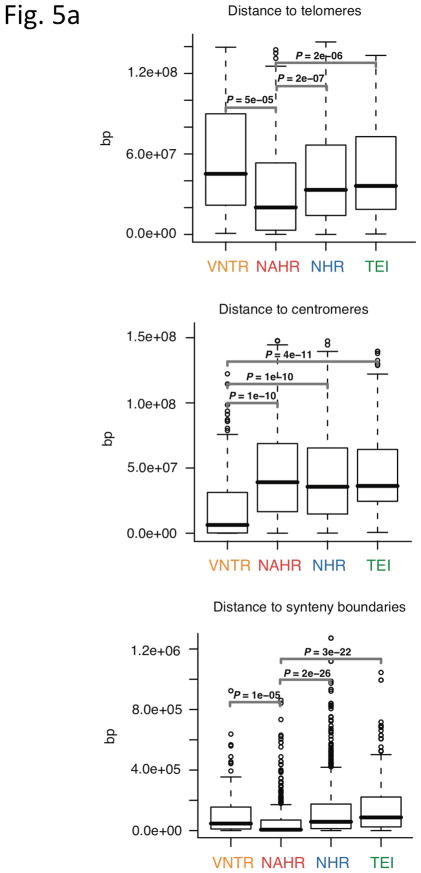
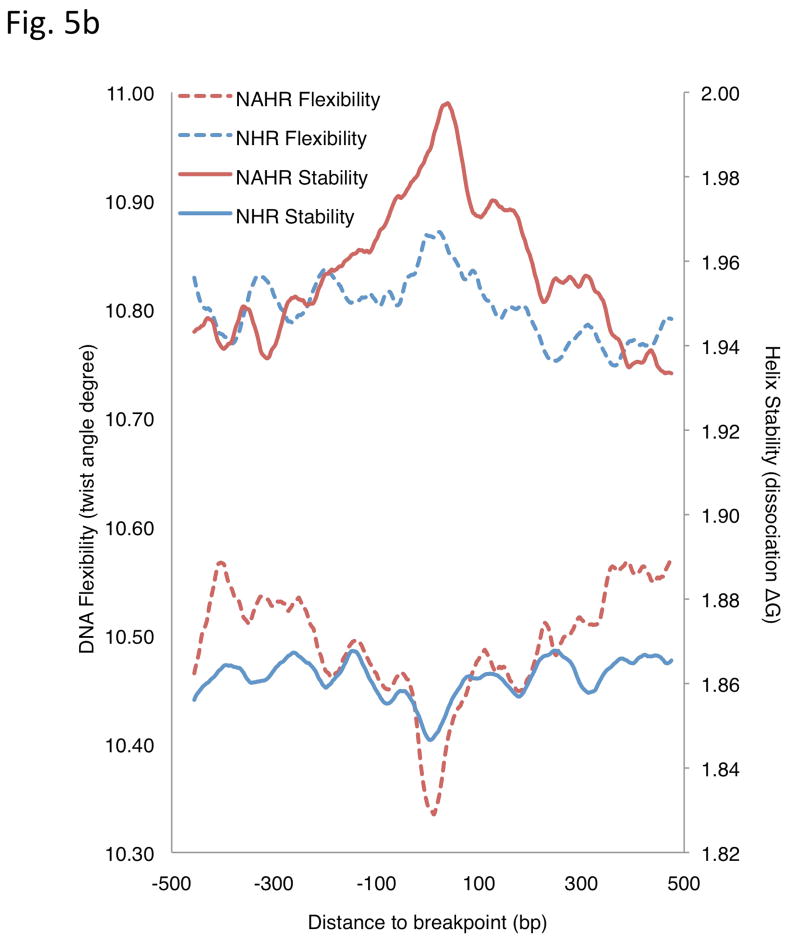
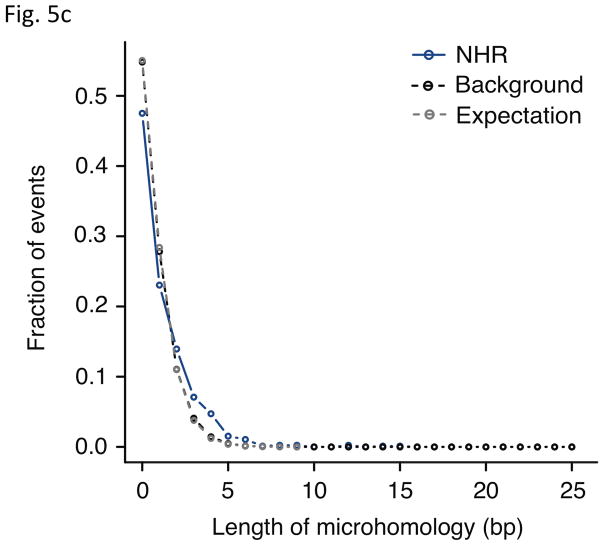
Analysis of breakpoint features. (a) Distance to chromosomal landmarks. Brackets indicate significantly different classes (P-value <0.05in Wilcoxon rank sum test after multiple hypothesis test correction by the Holm method). NAHR events are found to be significantly closer to telomeres and human-chimpanzee synteny block boundaries than the other mechanistic classes; VNTRs are significantly enriched in centromeric and pericentromeric regions. (b) DNA flexibility (dashed lines and left y-axis) and helix stability (solid lines and right y-axis) around NAHR and NHR breakpoints. (c) Distribution of NHR events with different lengths of microhomologies at the breakpoints. Microhomologies are significantly enriched in NHR breakpoints compared to a random background (KS test P-value=2.43E-11).


