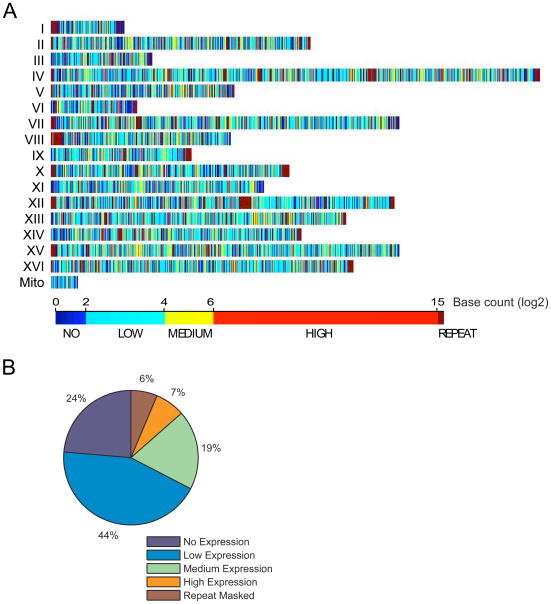
Figure 2. Extensive expression of the yeast genome revealed by RNA-Seq.
A) The genome distribution of transcribed regions. Colors represent different transcription levels for each base (log2 tag count). B) Distribution of transcribed regions on chromosome VI. C) Histogram of transcribed bases. D) A summary of the transcription level of the transcriptome.

