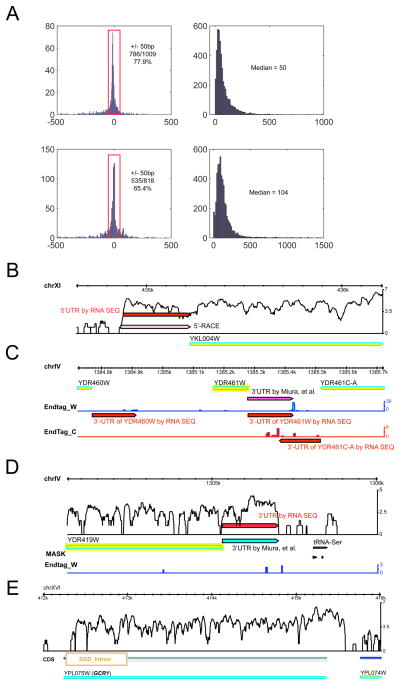
Figure 3. Analyses and mapping of 5′ and 3′ gene boundaries.
A) Size differences of 5′-UTR between RNA-Seq and our RACE data (top left) or RNA-Seq 3′-UTR data and cDNA sequencing data(7) (bottom left). Distributions of the size of 5′-UTR (top right) or 3′-UTR (bottom right) is also shown. B) A comparison of 5′-UTR determined by RNA-Seq or by 5′-RACE for gene YKL004W. C) 3′-UTR determined by RNA-Seq based on end tags for gene YDR460W, YDR004W, and YDR461-C, or YDR004W that is also determined by cDNA sequencing (7). Endtag_W and Endtag_C represent RNA-Seq reads that contain polyA tails on either Watson or Crick strands, respectively. D) 3′-UTR determined by RNA-Seq based on sharp expression decrease, comparing to cDNA data(7). End tags information were not used in this case due to low scores. UTR, untranslated region; RACE, rapid implication of cDNA ends

