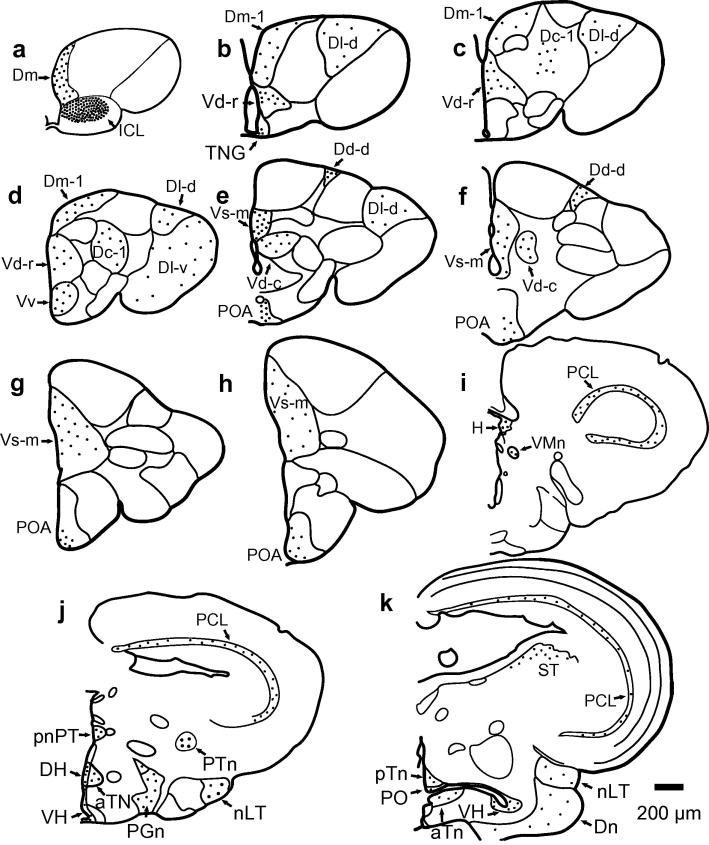
Figure 5.
Illustration of kiss1r mRNA expression in olfactory bulb, telencephalon, diencephalon, and mesencephalon. Dots indicate location and relative density of silver grains. (a-h) Illustration of kiss1r expression pattern in the olfactory bulb and telencephalon of A. burtoni (Brain outlines from Burmeister et al., 2009). (i-k) Illustration of kiss1r expression pattern in the diencephalon and mesencephalon of A. burtoni (Brain outlines from Fernald and Shelton, 1985). Scale bar represents 200 μm.

